\n
## Bar Chart: Mean Ratio of Token Types by Model
### Overview
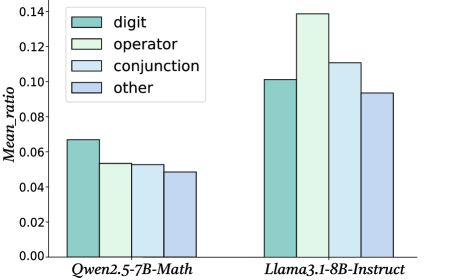
This bar chart compares the mean ratio of different token types (digit, operator, conjunction, and other) for two language models: Qwen2.5-7B-Math and Llama3.1-8B-Instruct. The chart uses grouped bars to represent each token type within each model.
### Components/Axes
* **X-axis:** Model Name (Qwen2.5-7B-Math, Llama3.1-8B-Instruct)
* **Y-axis:** Mean\_ratio (ranging from 0.00 to 0.14)
* **Legend:**
* digit (light green)
* operator (pale green)
* conjunction (light blue)
* other (pale blue)
### Detailed Analysis
The chart consists of two groups of four bars, one for each model. Within each group, each bar represents the mean ratio for a specific token type.
**Qwen2.5-7B-Math:**
* **digit:** The light green bar for 'digit' is approximately 0.065.
* **operator:** The pale green bar for 'operator' is approximately 0.055.
* **conjunction:** The light blue bar for 'conjunction' is approximately 0.050.
* **other:** The pale blue bar for 'other' is approximately 0.048.
**Llama3.1-8B-Instruct:**
* **digit:** The light green bar for 'digit' is approximately 0.135.
* **operator:** The pale green bar for 'operator' is approximately 0.115.
* **conjunction:** The light blue bar for 'conjunction' is approximately 0.105.
* **other:** The pale blue bar for 'other' is approximately 0.090.
### Key Observations
* Llama3.1-8B-Instruct consistently exhibits higher mean ratios across all token types compared to Qwen2.5-7B-Math.
* For both models, the 'digit' token type has the highest mean ratio, followed by 'operator', 'conjunction', and 'other'.
* The difference in mean ratios between the two models is most pronounced for the 'digit' token type.
### Interpretation
The data suggests that Llama3.1-8B-Instruct is more inclined to generate or process text containing digits, operators, conjunctions, and other token types compared to Qwen2.5-7B-Math. This could indicate that Llama3.1-8B-Instruct is better suited for tasks involving mathematical reasoning or code generation, where these token types are more prevalent. The consistently higher ratios across all categories suggest a fundamental difference in the models' token distribution preferences. The large difference in the 'digit' category is particularly noteworthy, potentially indicating a stronger mathematical capability in Llama3.1-8B-Instruct. The chart provides a quantitative comparison of the token type distributions, offering insights into the models' strengths and weaknesses.