## Line Chart: Success Rate vs. Number of Actions for Different Language Models
### Overview
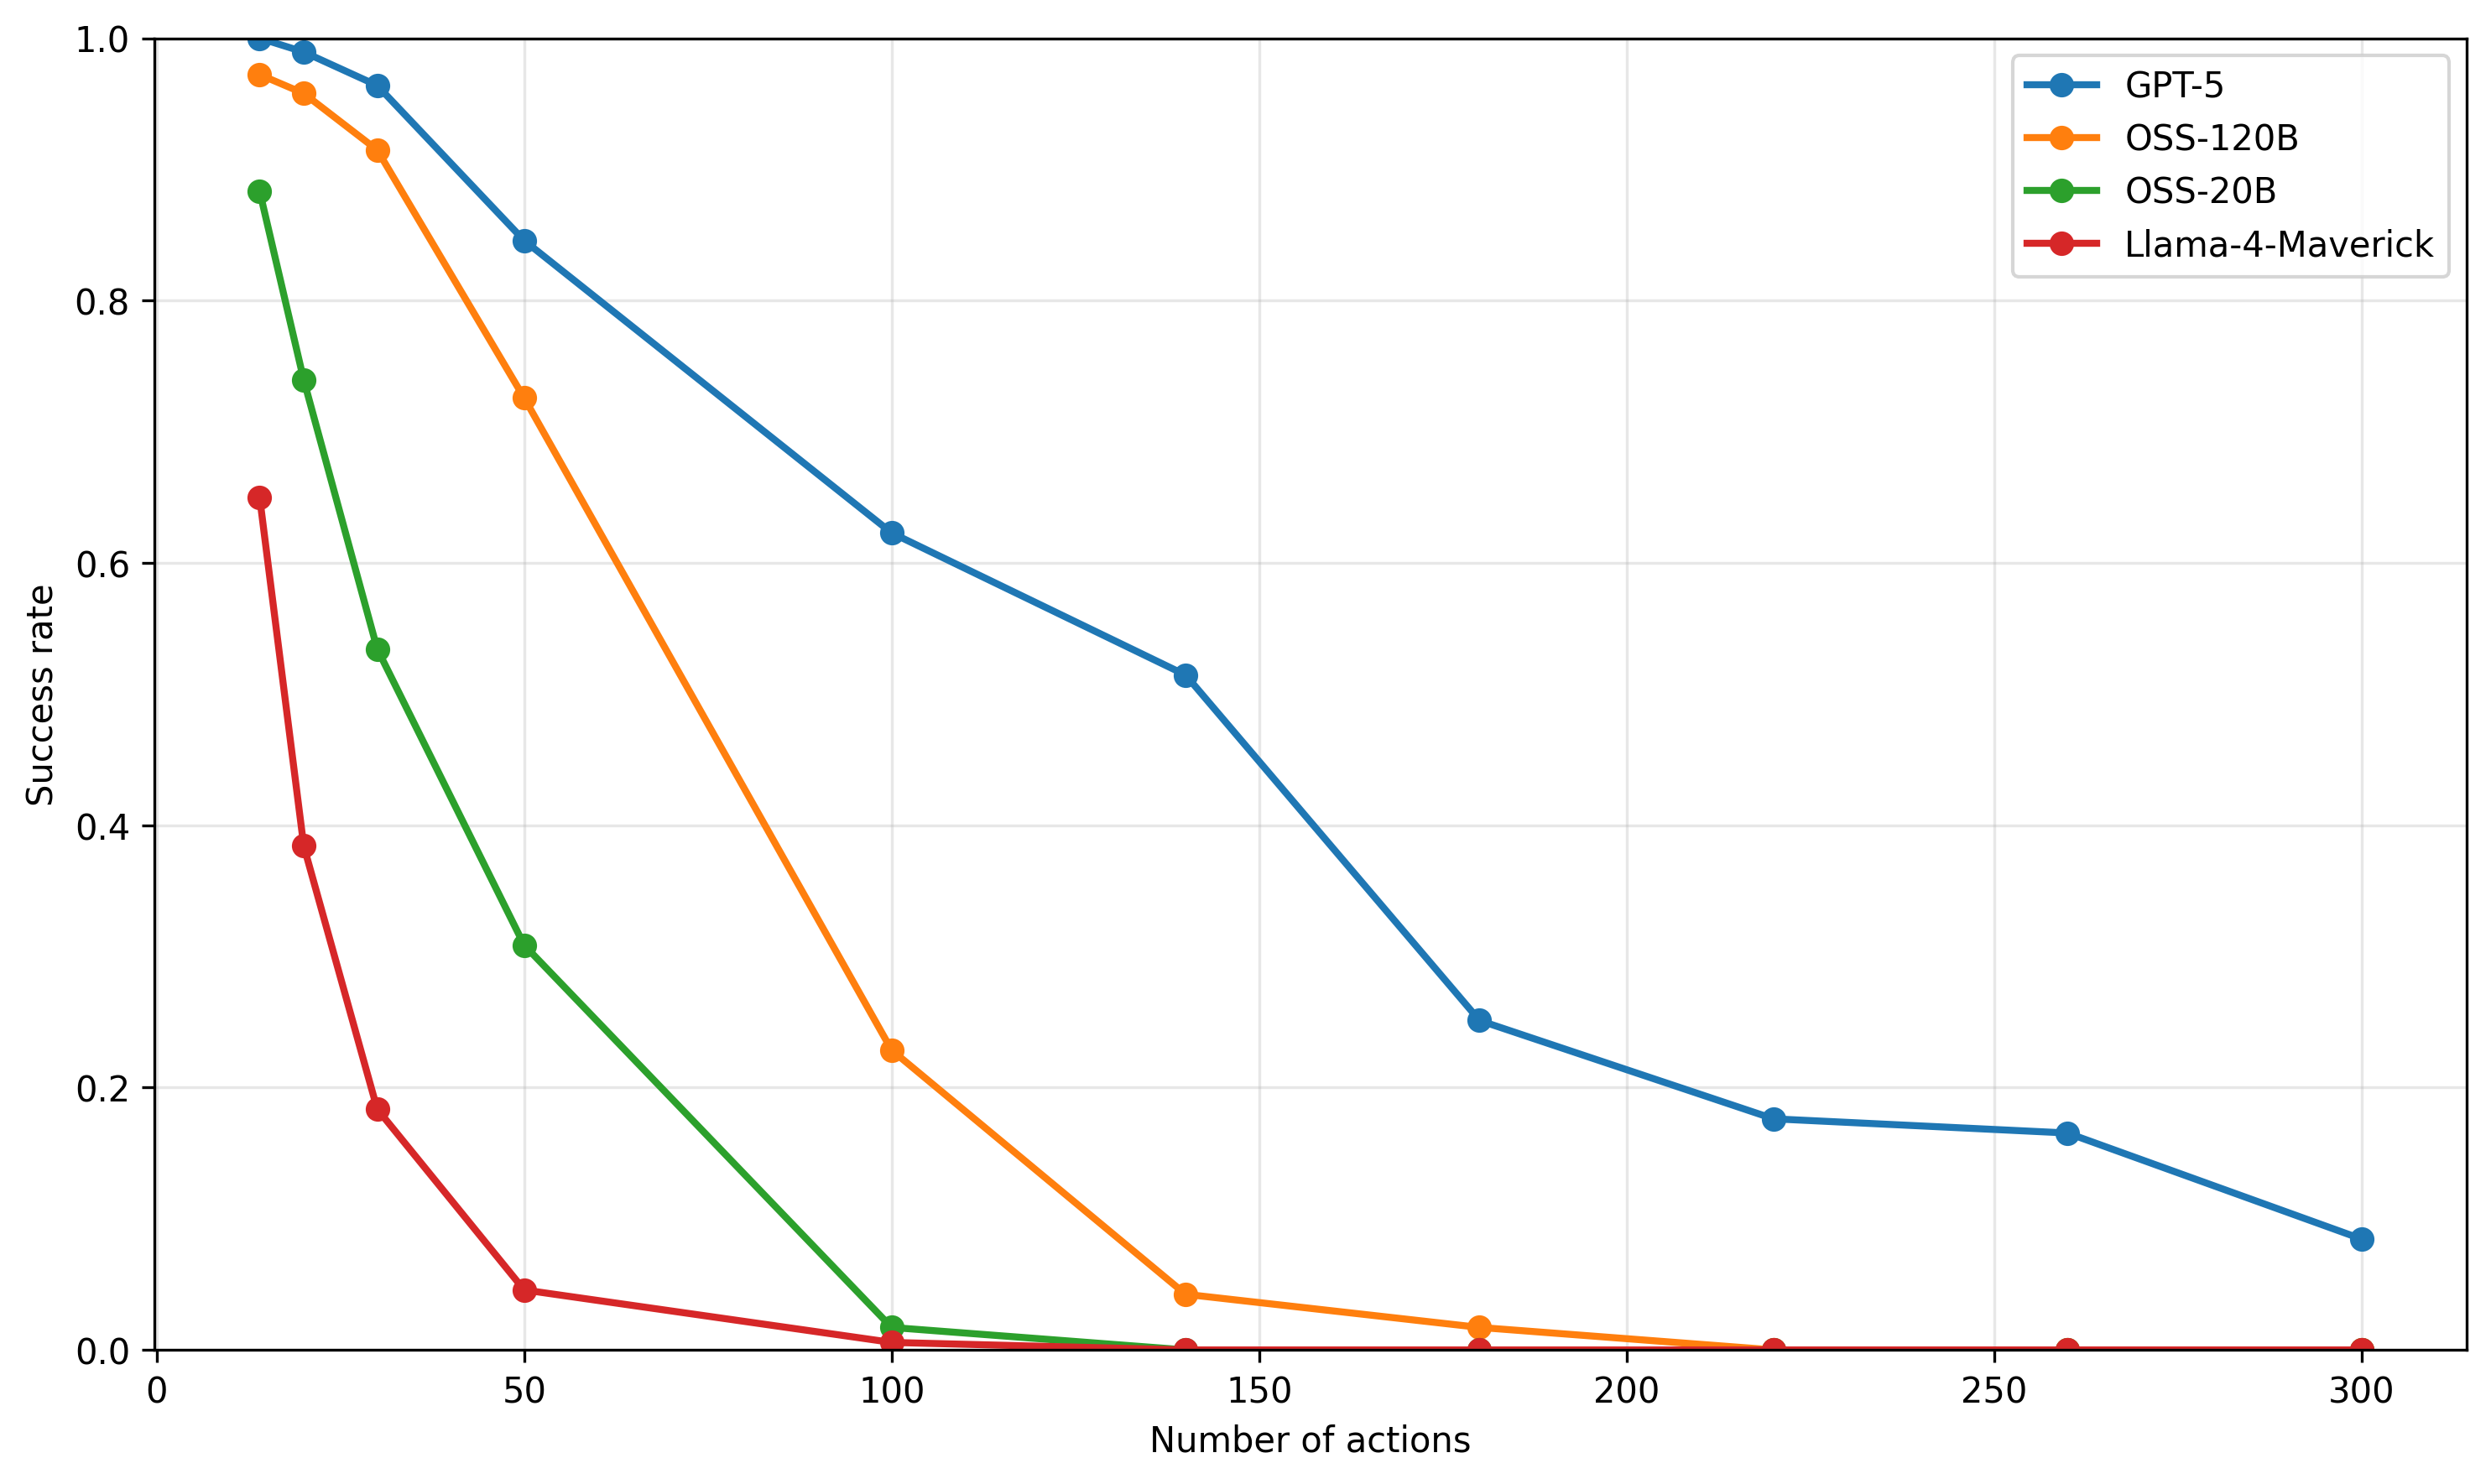
The image is a line chart comparing the success rate of four different language models (GPT-5, OSS-120B, OSS-20B, and Llama-4-Maverick) as the number of actions increases. The chart plots the success rate on the y-axis against the number of actions on the x-axis. Each model is represented by a different colored line with circular markers.
### Components/Axes
* **X-axis:** Number of actions, ranging from 0 to 300 in increments of 50.
* **Y-axis:** Success rate, ranging from 0.0 to 1.0 in increments of 0.2.
* **Legend (Top-Right):**
* Blue: GPT-5
* Orange: OSS-120B
* Green: OSS-20B
* Red: Llama-4-Maverick
### Detailed Analysis
* **GPT-5 (Blue):** The success rate starts at approximately 1.0 and gradually decreases as the number of actions increases.
* (0, 1.0)
* (25, 0.98)
* (50, 0.84)
* (100, 0.62)
* (150, 0.51)
* (200, 0.18)
* (250, 0.16)
* (300, 0.08)
* **OSS-120B (Orange):** The success rate starts near 1.0 and decreases more rapidly than GPT-5.
* (0, 0.98)
* (25, 0.92)
* (50, 0.72)
* (100, 0.22)
* (150, 0.02)
* (200, 0.01)
* (250, 0.00)
* (300, 0.00)
* **OSS-20B (Green):** The success rate drops sharply as the number of actions increases.
* (0, 0.88)
* (25, 0.73)
* (50, 0.30)
* (100, 0.01)
* (150, 0.00)
* (200, 0.00)
* (250, 0.00)
* (300, 0.00)
* **Llama-4-Maverick (Red):** The success rate decreases very rapidly and plateaus near zero.
* (0, 0.65)
* (25, 0.38)
* (50, 0.18)
* (100, 0.03)
* (150, 0.00)
* (200, 0.00)
* (250, 0.00)
* (300, 0.00)
### Key Observations
* GPT-5 maintains the highest success rate across all numbers of actions compared to the other models.
* Llama-4-Maverick and OSS-20B experience the most rapid decline in success rate.
* All models eventually converge to a success rate near zero as the number of actions increases.
### Interpretation
The chart illustrates the performance of different language models in terms of maintaining success as the number of actions increases. GPT-5 demonstrates the most robust performance, suggesting it is better at handling a larger sequence of actions while maintaining a higher success rate. The other models, particularly Llama-4-Maverick and OSS-20B, are more susceptible to performance degradation as the number of actions increases. This could indicate differences in model architecture, training data, or optimization strategies. The convergence of all models to a near-zero success rate at higher action counts suggests a common limitation in handling very long sequences, possibly due to error accumulation or vanishing gradients.