## Line Chart: Success Rate vs. Number of Actions
### Overview
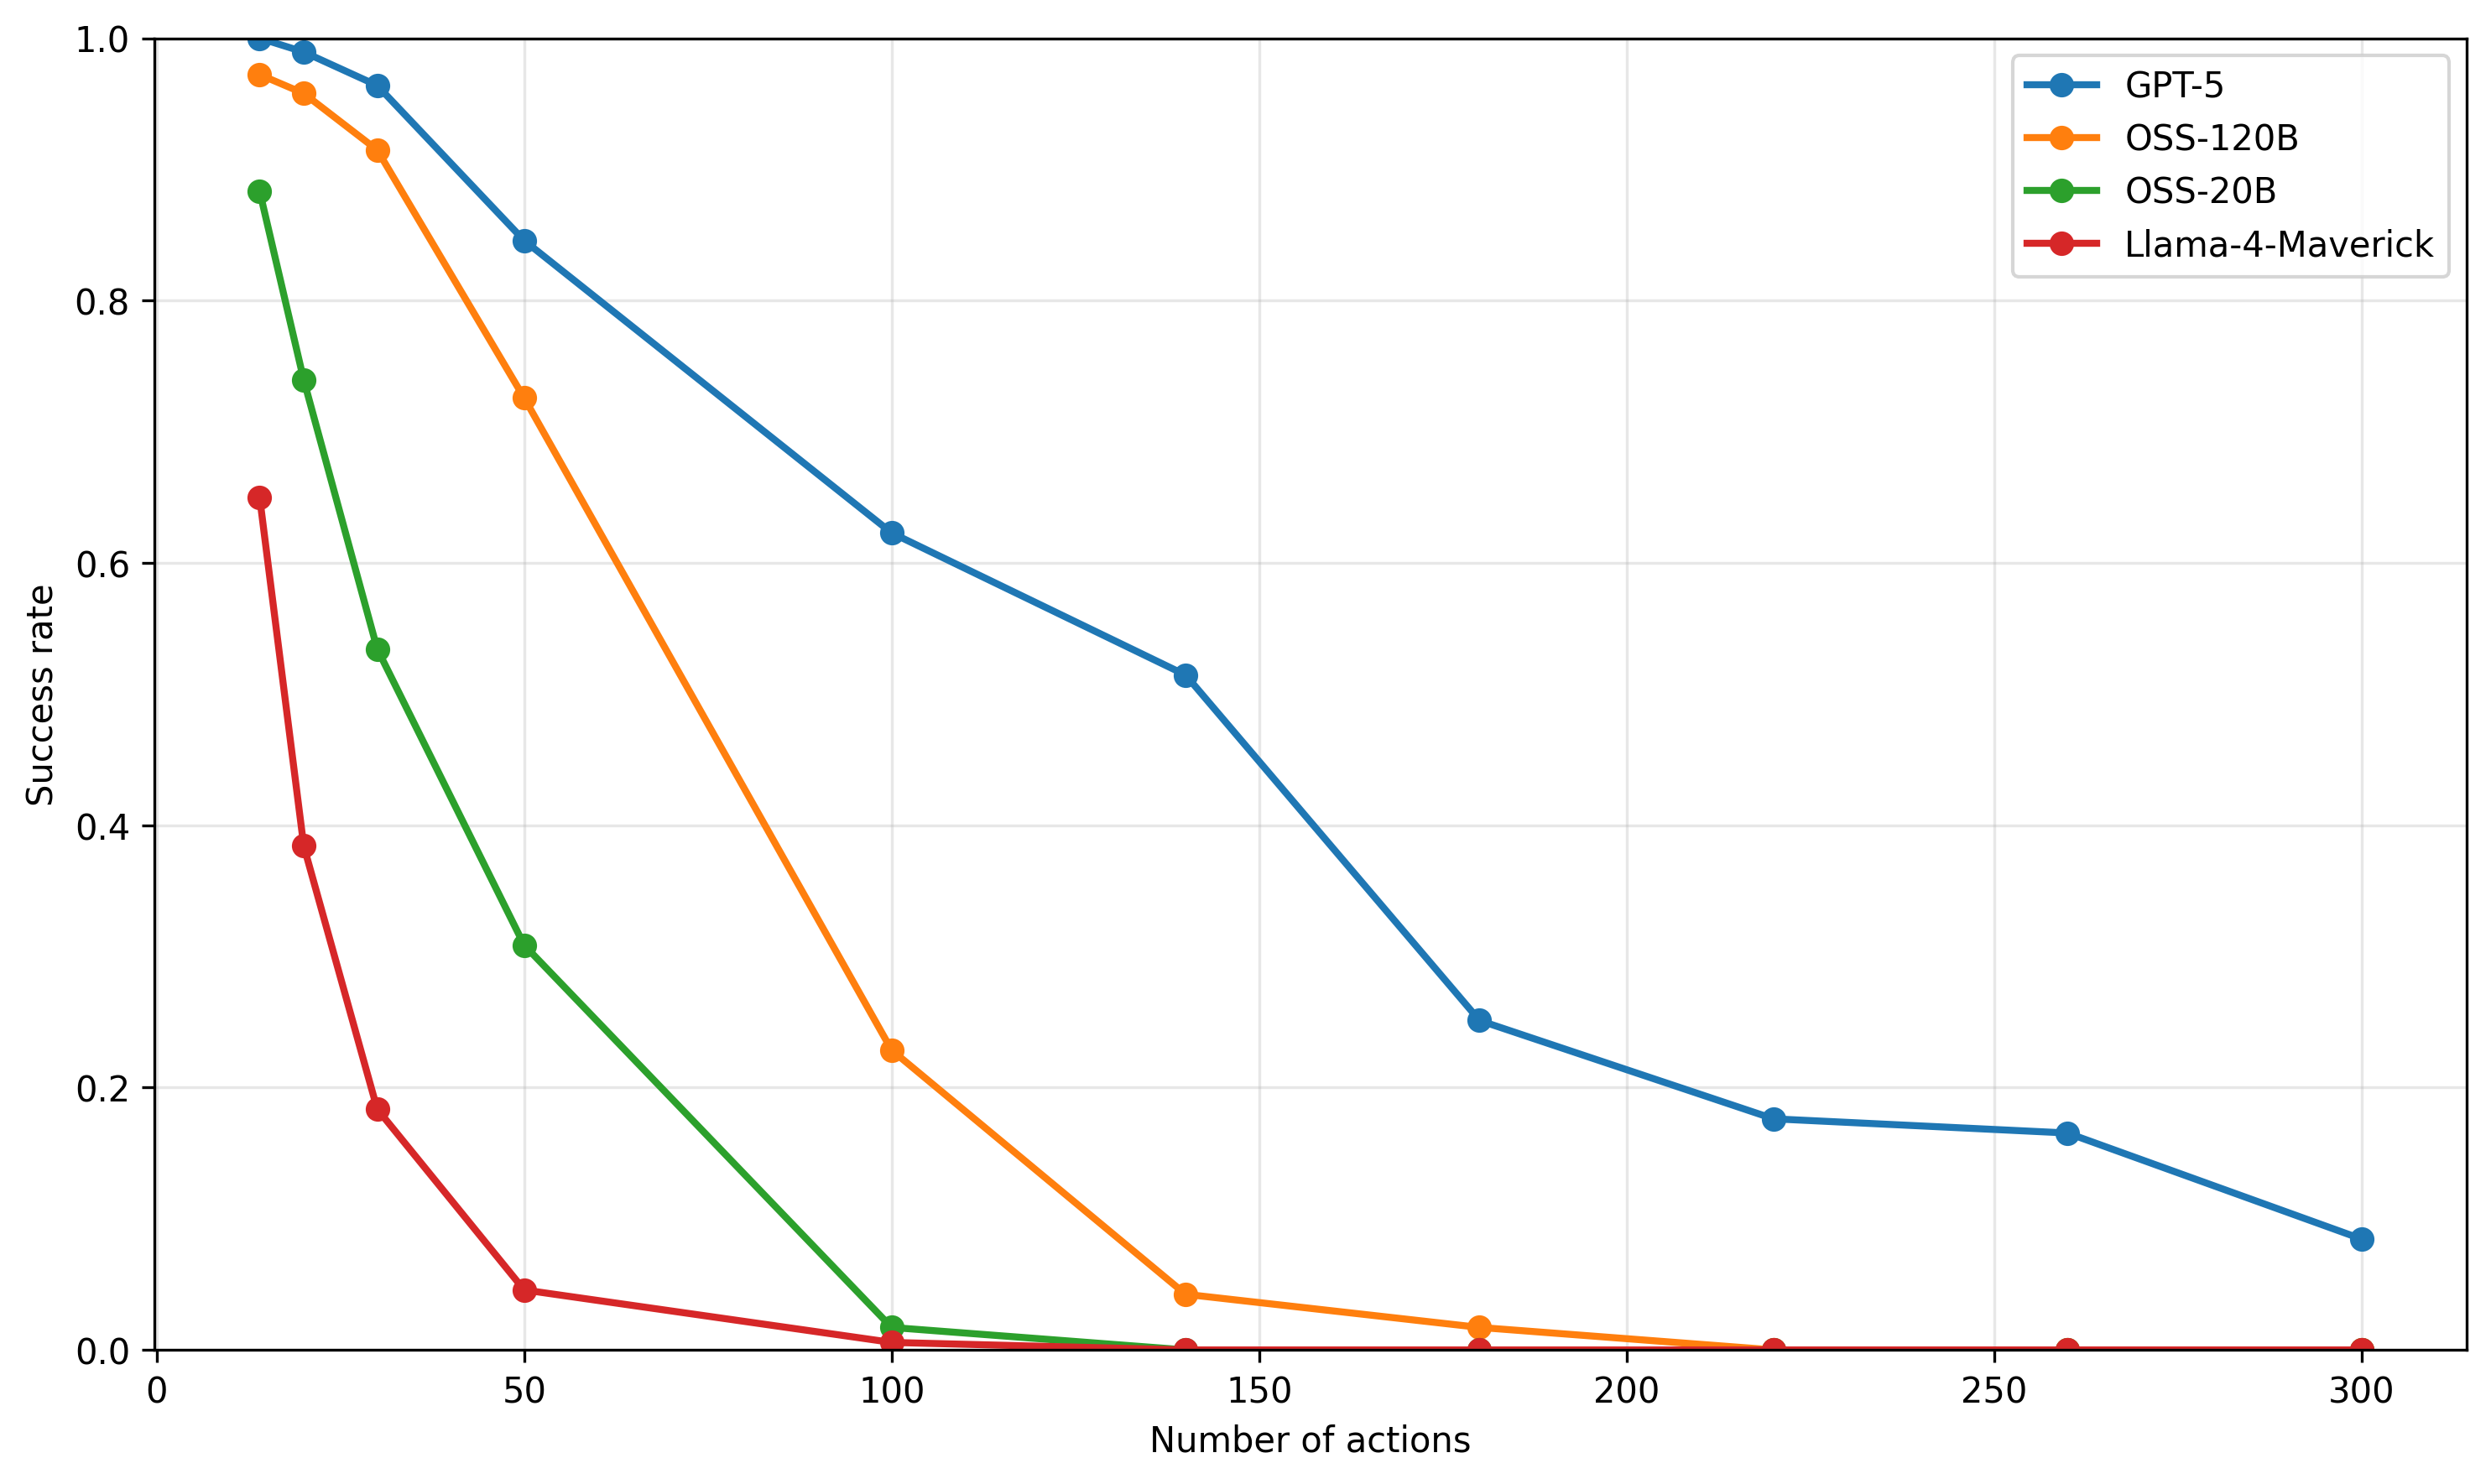
This line chart depicts the success rate of four different models (GPT-5, OSS-120B, OSS-20B, and Llama-4-Maverick) as a function of the number of actions taken. The success rate is plotted on the y-axis, ranging from 0 to 1.0, while the number of actions is plotted on the x-axis, ranging from 0 to 300. The chart illustrates how the performance of each model degrades as the number of actions increases.
### Components/Axes
* **X-axis Title:** "Number of actions"
* **Y-axis Title:** "Success rate"
* **Legend:** Located in the top-right corner of the chart.
* **GPT-5:** Blue line with circle markers.
* **OSS-120B:** Orange line with circle markers.
* **OSS-20B:** Teal line with circle markers.
* **Llama-4-Maverick:** Red line with circle markers.
* **Gridlines:** Present to aid in reading values.
* **Data Range (X-axis):** 0 to 300
* **Data Range (Y-axis):** 0 to 1.0
### Detailed Analysis
Here's a breakdown of each model's performance, with approximate values extracted from the chart:
* **GPT-5 (Blue):** The line starts at approximately 0.98 at 0 actions. It slopes downward, relatively slowly.
* At 50 actions: ~0.85
* At 100 actions: ~0.70
* At 150 actions: ~0.55
* At 200 actions: ~0.35
* At 250 actions: ~0.20
* At 300 actions: ~0.10
* **OSS-120B (Orange):** The line begins at approximately 0.80 at 0 actions and declines rapidly.
* At 50 actions: ~0.30
* At 100 actions: ~0.10
* At 150 actions: ~0.02
* From 150 to 300 actions: Remains very close to 0.
* **OSS-20B (Teal):** Starts at approximately 0.95 at 0 actions and declines at a moderate rate.
* At 50 actions: ~0.75
* At 100 actions: ~0.60
* At 150 actions: ~0.45
* At 200 actions: ~0.30
* At 250 actions: ~0.20
* At 300 actions: ~0.10
* **Llama-4-Maverick (Red):** Starts at approximately 0.40 at 0 actions and declines very rapidly.
* At 50 actions: ~0.05
* At 100 actions: ~0.01
* From 100 to 300 actions: Remains very close to 0.
### Key Observations
* GPT-5 exhibits the highest success rate across all action counts, demonstrating the most robust performance.
* Llama-4-Maverick has the lowest success rate, and its performance degrades extremely quickly with increasing actions.
* OSS-120B and OSS-20B show a similar trend of rapid decline, but OSS-20B maintains a slightly higher success rate than OSS-120B.
* All models experience a decrease in success rate as the number of actions increases, indicating a challenge in maintaining performance with complex tasks.
### Interpretation
The chart demonstrates the scalability and robustness of different language models in performing sequential tasks. The success rate is used as a metric to evaluate the model's ability to achieve a desired outcome after a series of actions. GPT-5 clearly outperforms the other models, suggesting it is better equipped to handle complex, multi-step processes. The rapid decline in performance for OSS-120B, OSS-20B, and especially Llama-4-Maverick indicates that these models struggle with tasks requiring a large number of coordinated actions. This could be due to limitations in their ability to maintain context, reason about long-term dependencies, or avoid accumulating errors over multiple steps. The data suggests that model size and architecture play a significant role in the ability to perform complex tasks effectively. The chart highlights the importance of considering the number of actions required for a task when selecting a language model.