## Line Chart: Success Rate vs. Number of Actions
### Overview
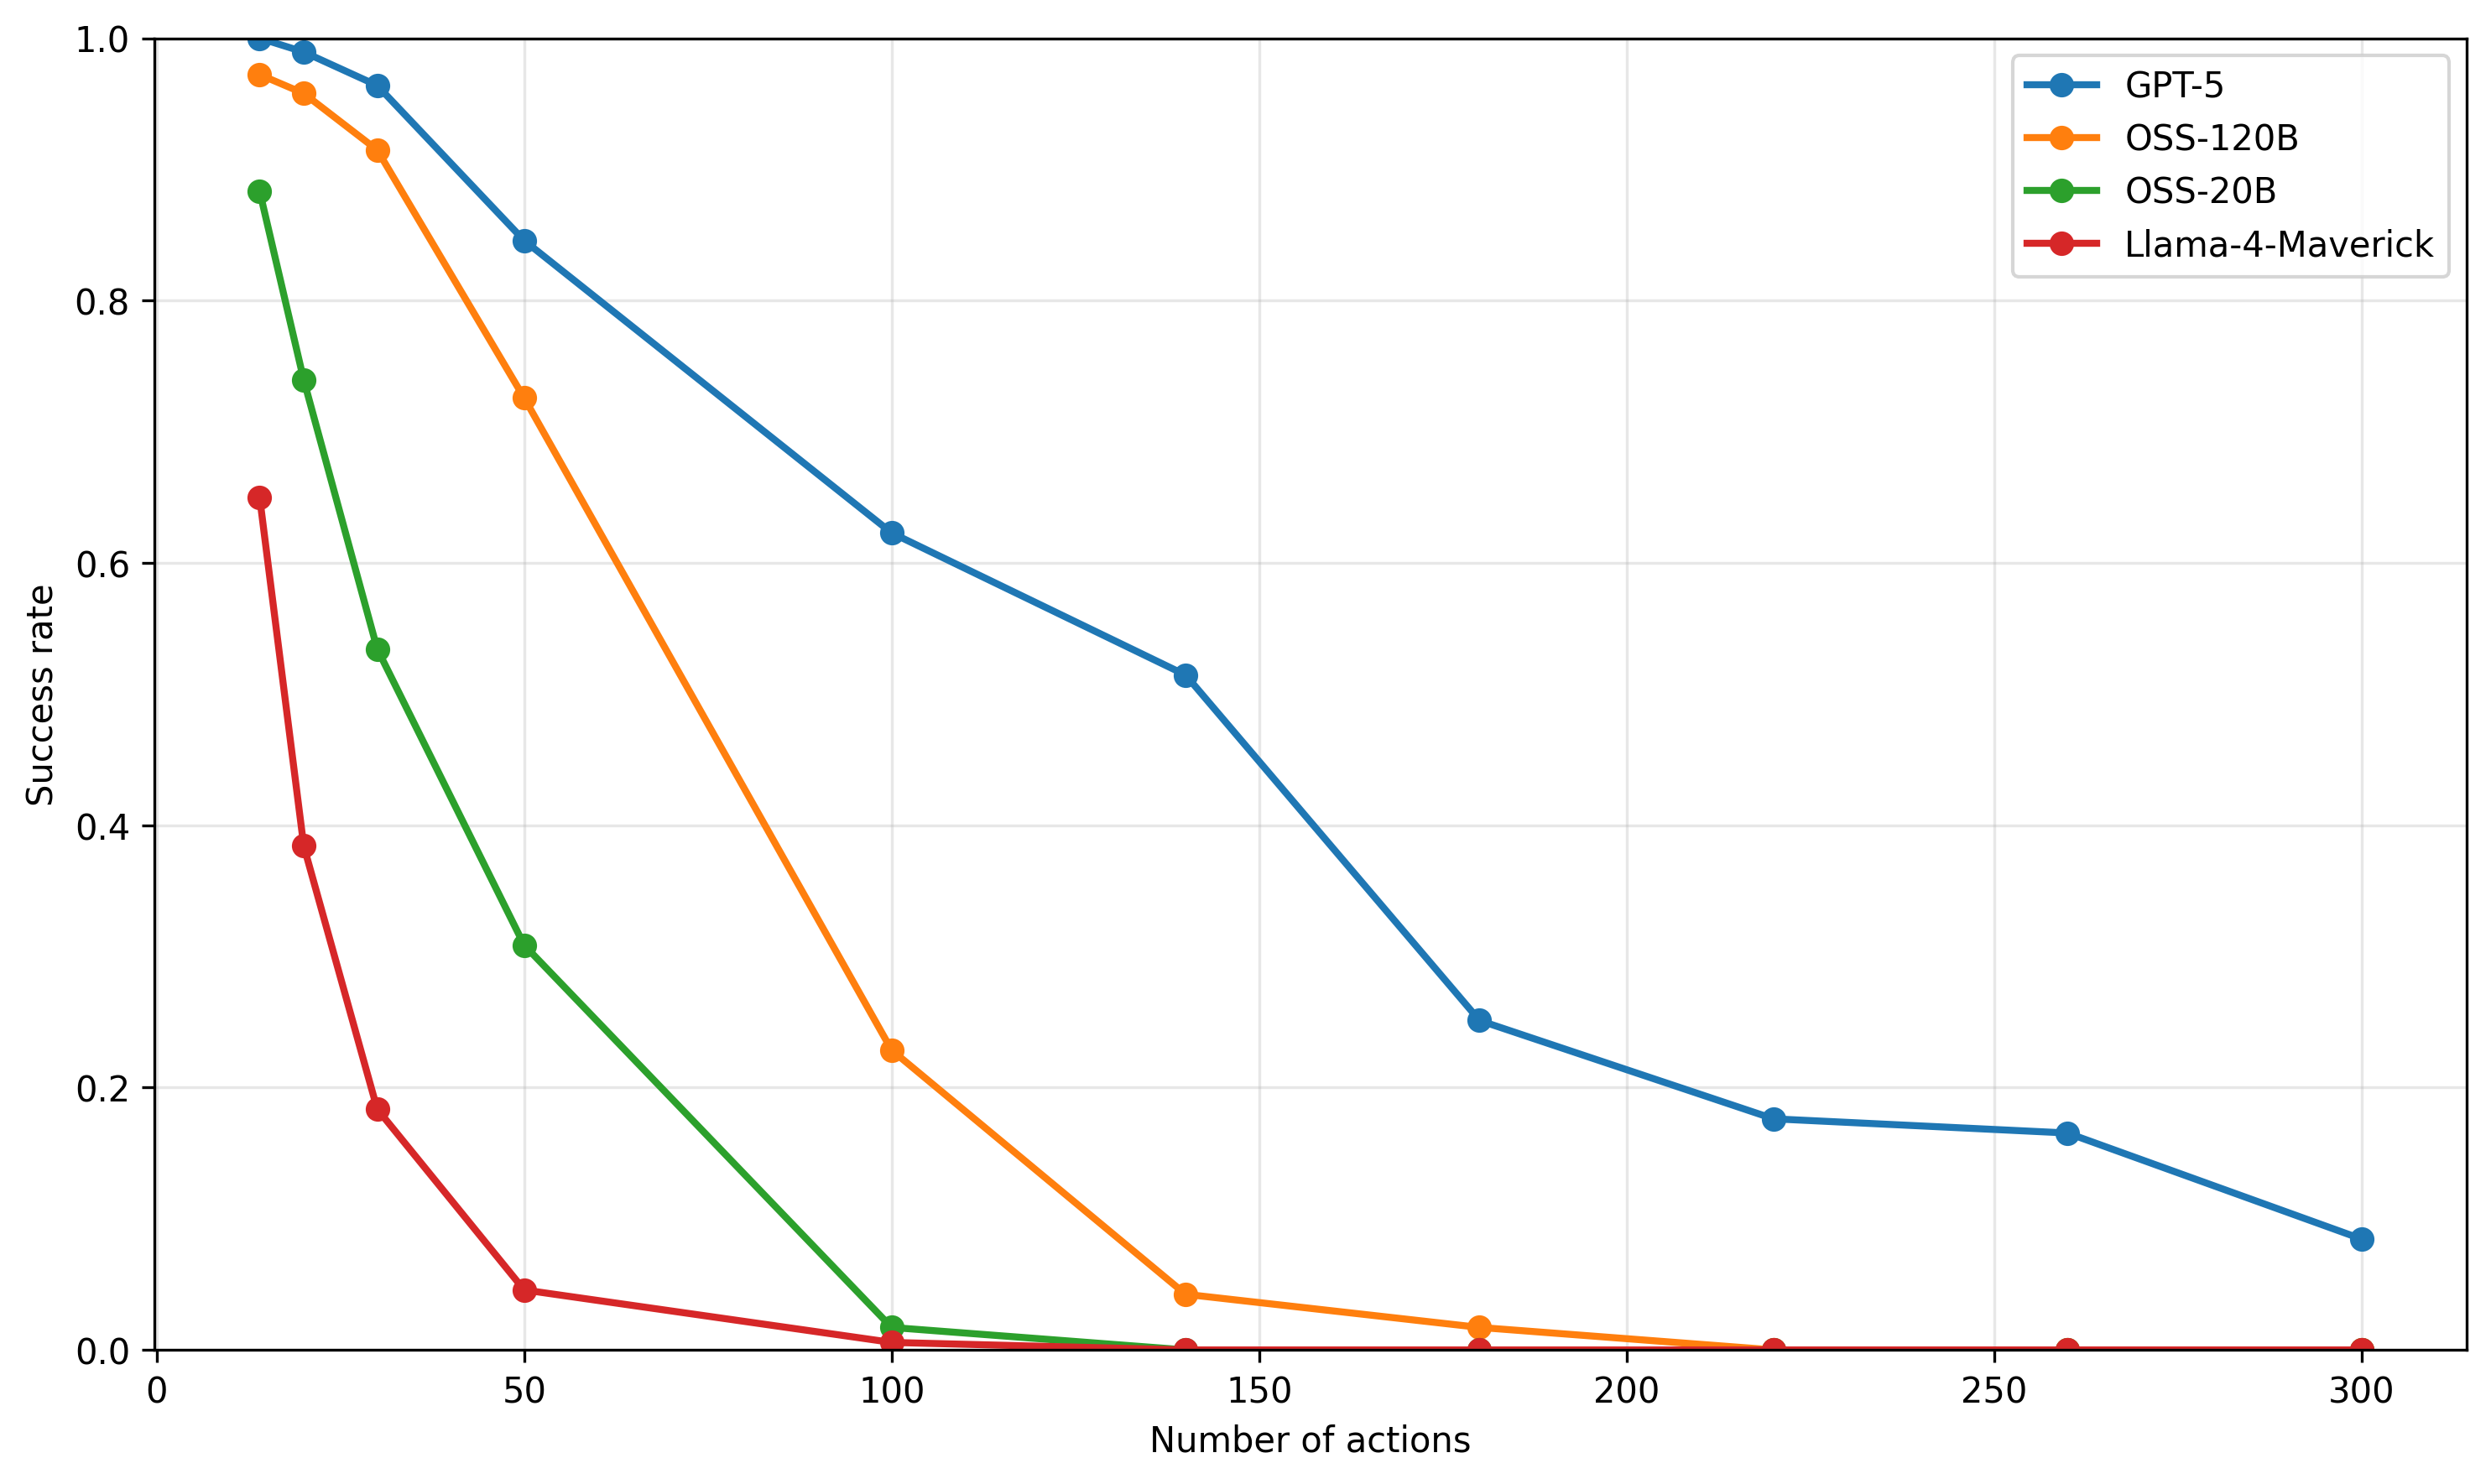
The chart illustrates the success rate of four AI models (GPT-5, OSS-120B, OSS-20B, Llama-4-Maverick) as the number of actions increases from 0 to 300. Success rate is plotted on the y-axis (0–1.0), while the x-axis represents the number of actions. All models show declining success rates with increasing actions, but the rate of decline varies significantly.
### Components/Axes
- **X-axis**: "Number of actions" (0–300, linear scale).
- **Y-axis**: "Success rate" (0–1.0, linear scale).
- **Legend**: Located in the top-right corner, mapping colors to models:
- Blue: GPT-5
- Orange: OSS-120B
- Green: OSS-20B
- Red: Llama-4-Maverick
### Detailed Analysis
1. **GPT-5 (Blue Line)**:
- Starts at **1.0 success rate** at 0 actions.
- Declines steadily, reaching **~0.62 at 100 actions**, **~0.25 at 200 actions**, and **~0.08 at 300 actions**.
- Maintains the highest success rate throughout.
2. **OSS-120B (Orange Line)**:
- Begins at **~0.98 at 0 actions**.
- Drops sharply to **~0.22 at 100 actions**, then plateaus near **0.01** by 300 actions.
- Steeper decline than GPT-5 but starts slightly higher.
3. **OSS-20B (Green Line)**:
- Starts at **~0.88 at 0 actions**.
- Declines gradually to **~0.02 at 100 actions**, then near **0.0** by 300 actions.
- Slower decline than OSS-120B but lower initial success rate.
4. **Llama-4-Maverick (Red Line)**:
- Begins at **~0.65 at 0 actions**.
- Plummets to **~0.0** by 50 actions, remaining at 0 thereafter.
- Most drastic decline, with no success beyond 50 actions.
### Key Observations
- **GPT-5** consistently outperforms all models across all action counts.
- **OSS-120B** and **OSS-20B** show similar initial performance but diverge in decline rate.
- **Llama-4-Maverick** fails catastrophically after 50 actions, suggesting poor scalability.
- No lines intersect, indicating no model overtakes another in performance.
### Interpretation
The data suggests **GPT-5** is the most robust model for handling increasing action loads, likely due to architectural advantages or superior training. The OSS models (120B and 20B) exhibit diminishing returns more rapidly, possibly due to resource constraints or optimization gaps. Llama-4-Maverick’s abrupt failure implies critical limitations in its design or training data. The trends highlight trade-offs between model complexity (e.g., OSS-120B’s larger size vs. GPT-5’s efficiency) and real-world applicability under dynamic workloads.