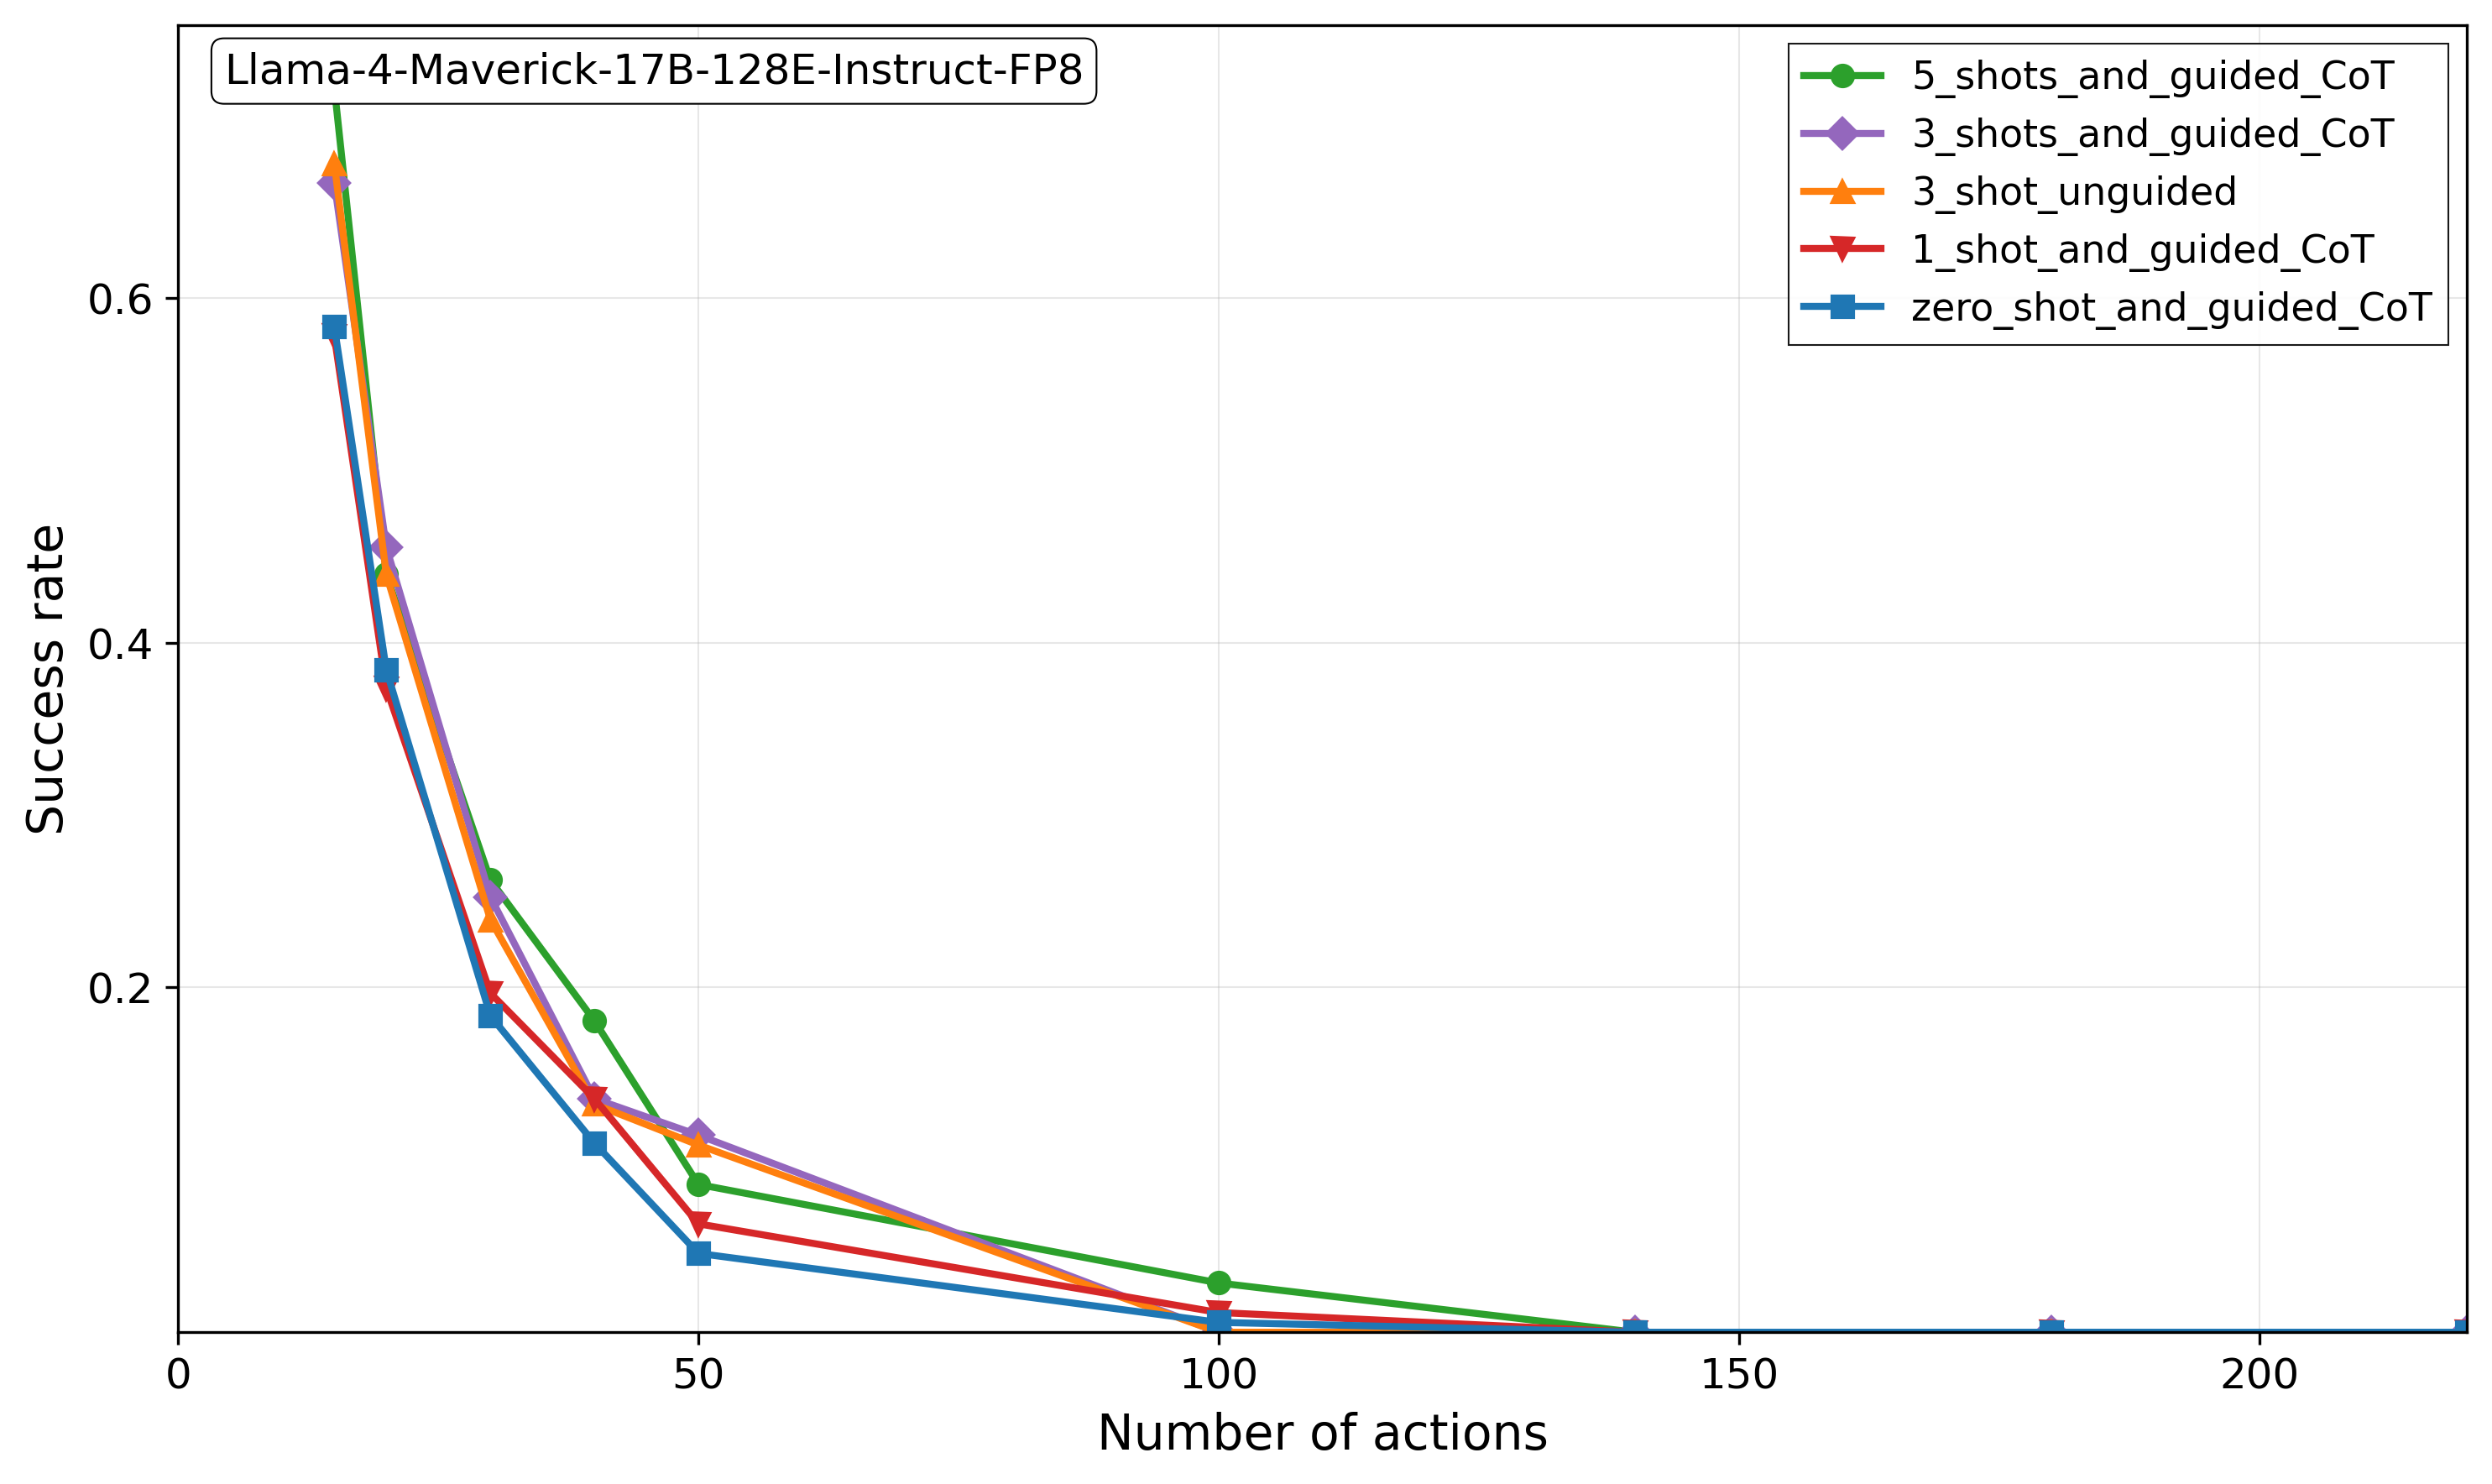
## Line Chart: Success Rate vs. Number of Actions for Llama-4-Maverick-17B-128E-Instruct-FP8
### Overview
The image is a line chart comparing the success rate of the Llama-4-Maverick-17B-128E-Instruct-FP8 model across different numbers of actions, using various "shot" configurations (0, 1, 3, and 5 shots) with guided or unguided Chain-of-Thought (CoT) prompting. The x-axis represents the number of actions, and the y-axis represents the success rate.
### Components/Axes
* **Title:** Llama-4-Maverick-17B-128E-Instruct-FP8 (located in the top-left corner within a rounded box)
* **X-axis:**
* Label: "Number of actions"
* Scale: 0 to 200, with major ticks at 50, 100, 150, and 200.
* **Y-axis:**
* Label: "Success rate"
* Scale: 0 to 0.6, with major ticks at 0, 0.2, 0.4, and 0.6.
* **Legend:** Located in the top-right corner.
* Green line with circle marker: "5\_shots\_and\_guided\_CoT"
* Purple line with diamond marker: "3\_shots\_and\_guided\_CoT"
* Orange line with triangle marker: "3\_shot\_unguided"
* Red line with inverted triangle marker: "1\_shot\_and\_guided\_CoT"
* Blue line with square marker: "zero\_shot\_and\_guided\_CoT"
### Detailed Analysis
* **5\_shots\_and\_guided\_CoT (Green):** The line starts at approximately (0, 0.68) and decreases to approximately (50, 0.12), then decreases further to approximately (100, 0.03), and remains nearly constant at approximately 0.02-0.03 for higher number of actions.
* **3\_shots\_and\_guided\_CoT (Purple):** The line starts at approximately (0, 0.48) and decreases to approximately (50, 0.09), then decreases further to approximately (150, 0.02), and remains nearly constant at approximately 0.02 for higher number of actions.
* **3\_shot\_unguided (Orange):** The line starts at approximately (0, 0.67) and decreases to approximately (50, 0.10), then decreases further to approximately (100, 0.02), and remains nearly constant at approximately 0.02 for higher number of actions.
* **1\_shot\_and\_guided\_CoT (Red):** The line starts at approximately (0, 0.45) and decreases to approximately (50, 0.06), then decreases further to approximately (100, 0.01), and remains nearly constant at approximately 0.01 for higher number of actions.
* **zero\_shot\_and\_guided\_CoT (Blue):** The line starts at approximately (0, 0.58) and decreases to approximately (50, 0.04), then decreases further to approximately (150, 0.01), and remains nearly constant at approximately 0.01 for higher number of actions.
### Key Observations
* All lines show a decreasing trend in success rate as the number of actions increases.
* The "5\_shots\_and\_guided\_CoT" configuration generally has the highest success rate for lower number of actions (less than 50).
* The success rates for all configurations converge to a very low value (approximately 0.01-0.03) as the number of actions increases beyond 100.
* The zero-shot configuration has the lowest success rate for lower number of actions (less than 50).
### Interpretation
The chart illustrates the performance of the Llama-4-Maverick model under different prompting strategies as the number of actions increases. The initial success rate is highly dependent on the number of "shots" used in the prompt, with more shots generally leading to higher initial success. However, as the number of actions increases, the success rate for all configurations drops significantly and converges to a low level. This suggests that the model's ability to maintain success diminishes with longer sequences of actions, regardless of the initial prompting strategy. The guided CoT prompting appears to provide a slight advantage over the unguided approach, especially with a higher number of shots. The rapid decline in success rate indicates a potential limitation in the model's ability to handle complex or extended tasks.