TECHNICAL ASSET FINGERPRINT
29875ff1fb233e16d0f1cac1
Click to view fullscreen
Press ESC or click to close
FOUND IN PAPERS
EXPERT: gemini-2.5-flash-free VERSION 1
RUNTIME: google-free/gemini-2.5-flash
INTEL_VERIFIED
## Chart Type: Line Chart - Success Rate vs. Number of Actions for Llama-4-Maverick Model
### Overview
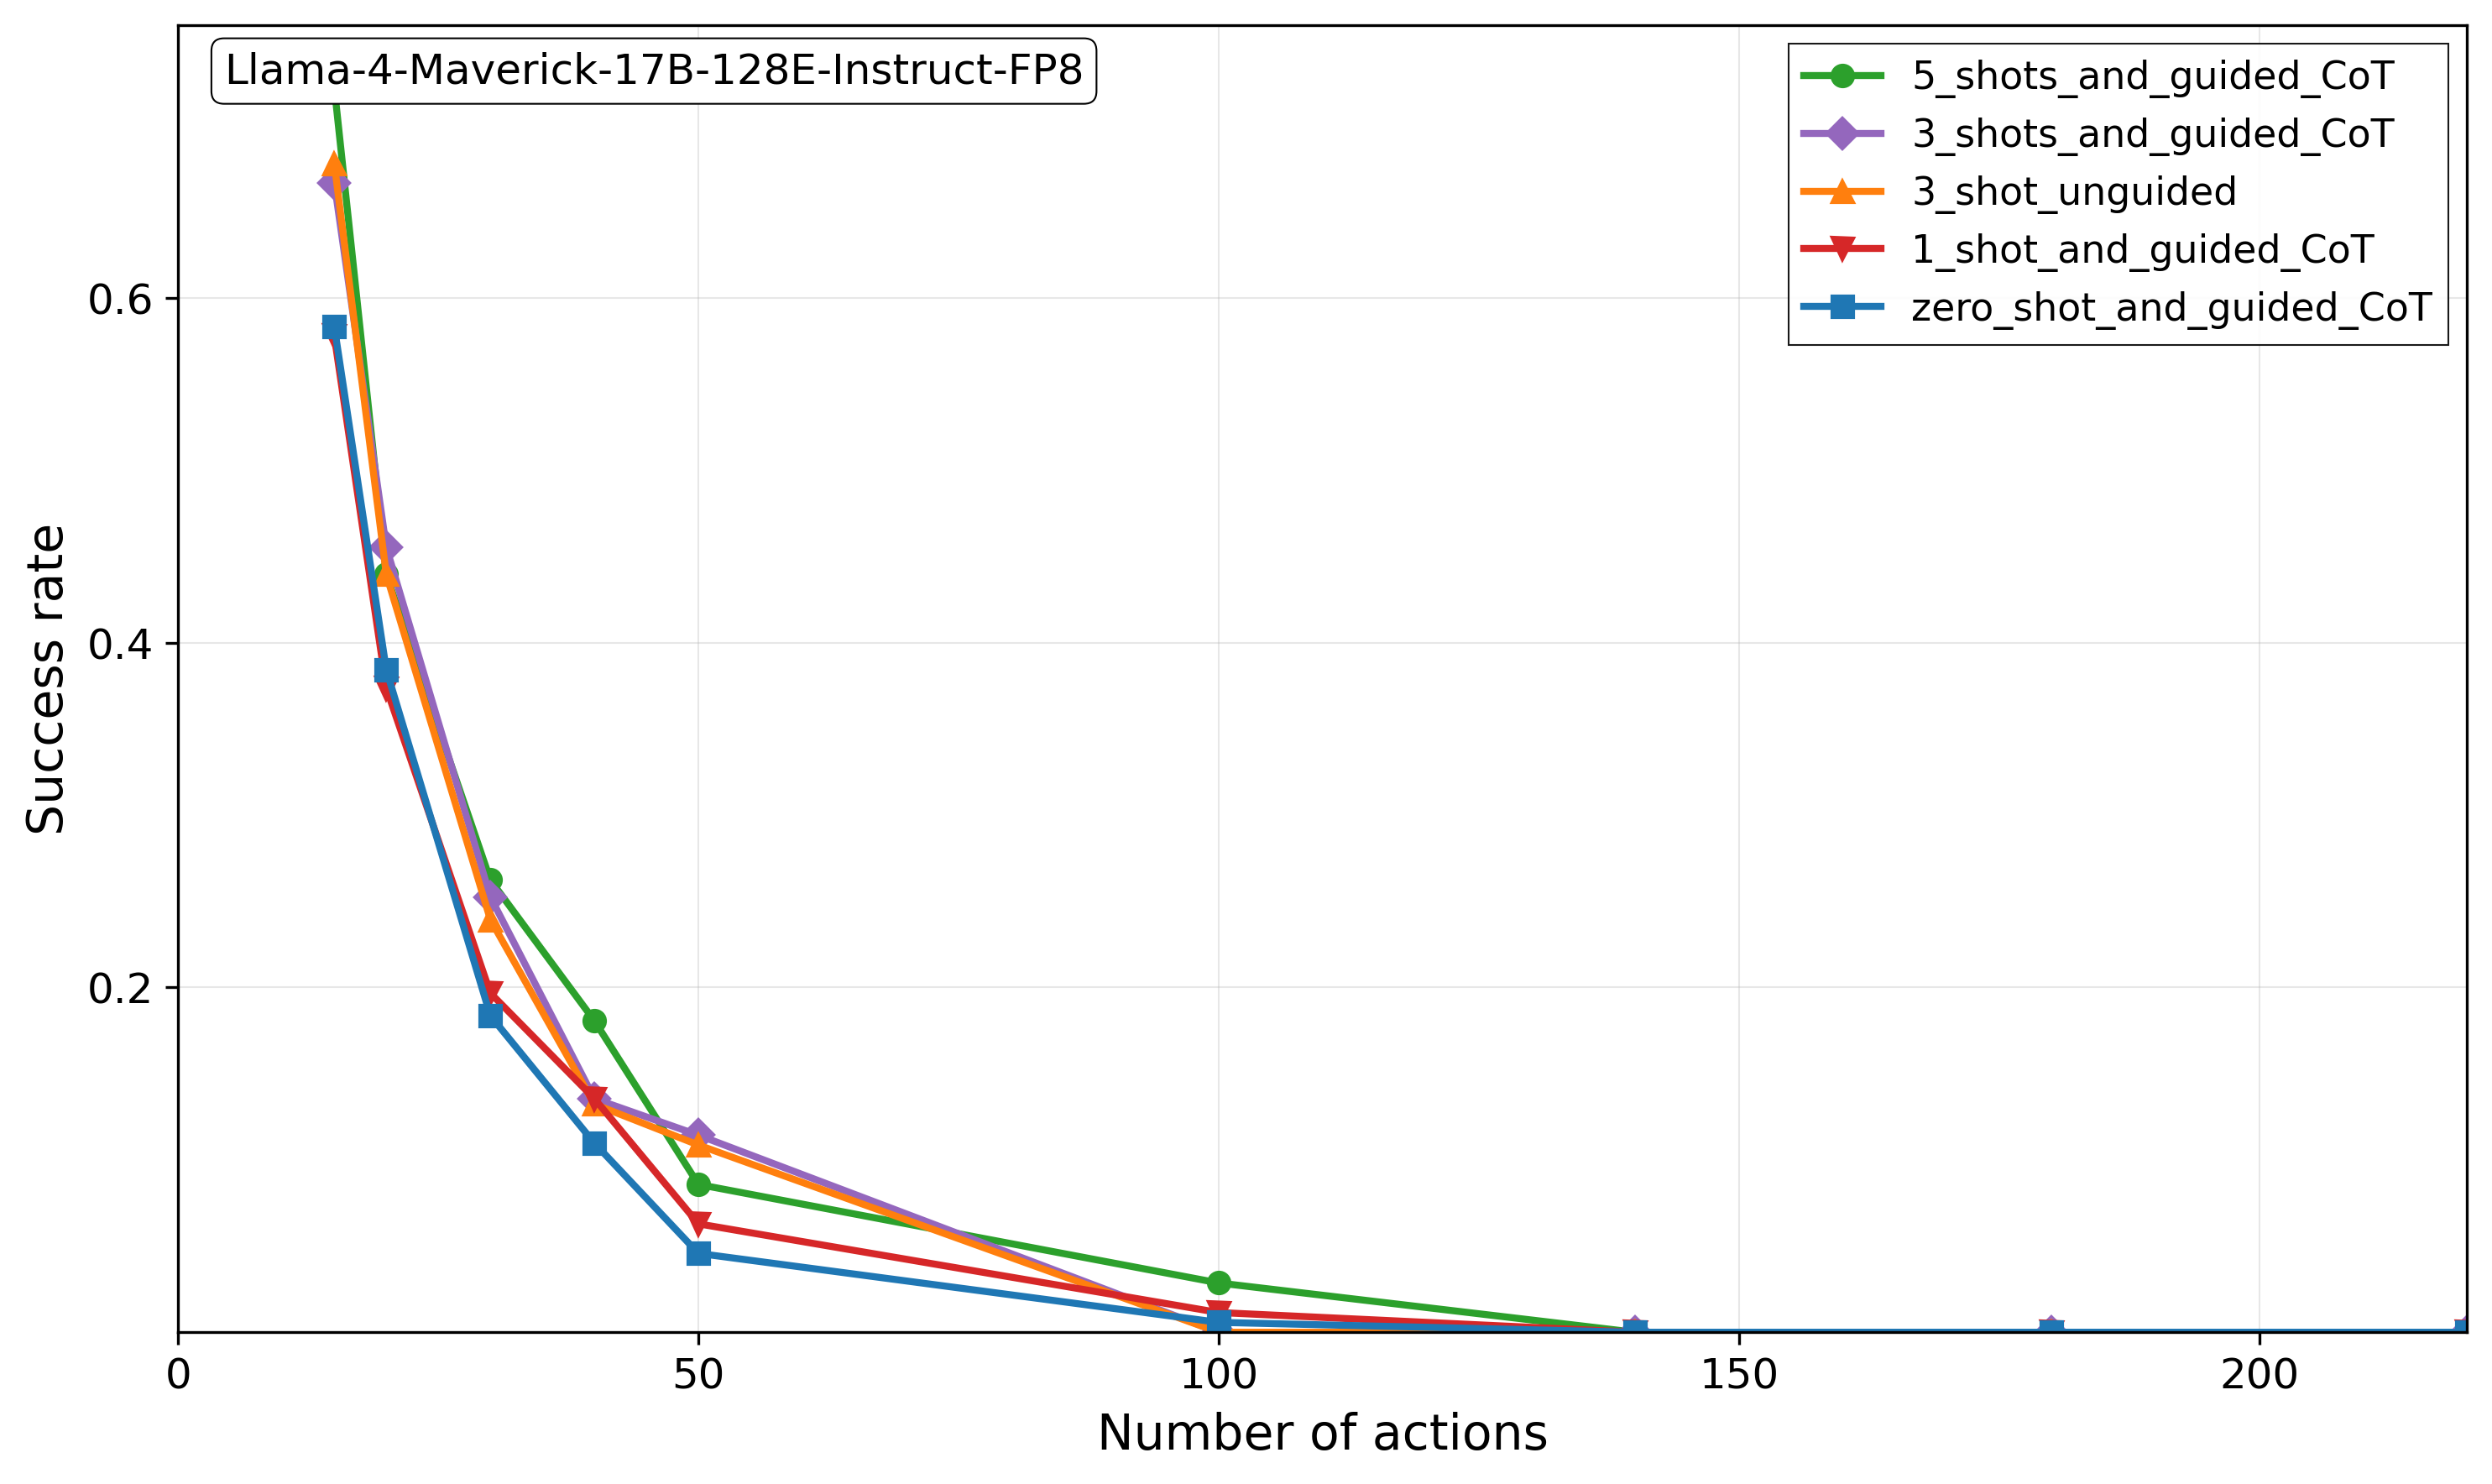
This image displays a line chart illustrating the "Success rate" as a function of the "Number of actions" for different configurations of the "Llama-4-Maverick-17B-128E-Instruct-FP8" model. Five distinct experimental setups are compared, varying in the number of "shots" (few-shot learning examples) and whether "guided CoT" (Chain-of-Thought) is employed. All lines show a rapid decrease in success rate with an increasing number of actions, eventually flattening out near zero.
### Components/Axes
**Chart Title (Top-left, within a white box with a black border):**
"Llama-4-Maverick-17B-128E-Instruct-FP8"
**X-axis:**
* **Title:** "Number of actions"
* **Range:** From 0 to approximately 225.
* **Major Ticks:** 0, 50, 100, 150, 200.
* **Grid Lines:** Vertical grid lines are present at each major tick mark.
**Y-axis:**
* **Title:** "Success rate"
* **Range:** From 0 to approximately 0.7.
* **Major Ticks:** 0, 0.2, 0.4, 0.6.
* **Grid Lines:** Horizontal grid lines are present at each major tick mark.
**Legend (Top-right, within a white box with a black border):**
The legend identifies five data series by color and marker:
* **Green line with circular markers:** "5_shots_and_guided_CoT"
* **Purple line with diamond markers:** "3_shots_and_guided_CoT"
* **Orange line with upward-pointing triangle markers:** "3_shot_unguided"
* **Red line with downward-pointing triangle markers:** "1_shot_and_guided_CoT"
* **Blue line with square markers:** "zero_shot_and_guided_CoT"
### Detailed Analysis
All five data series exhibit a similar overall trend: a steep decline in "Success rate" as the "Number of actions" increases, followed by a more gradual decrease, eventually approaching a success rate of zero. The most significant drop in success rate occurs within the first 50 actions for all configurations.
Here is a detailed breakdown of each series:
1. **Green line (5_shots_and_guided_CoT):**
* **Trend:** This line starts at the highest success rate and generally maintains the highest performance among all series for the initial range of actions. It shows a rapid decline up to approximately 50 actions, then a slower decline, flattening out near zero after about 100 actions.
* **Approximate Data Points (X, Y):**
* (X~12, Y~0.67)
* (X~22, Y~0.45)
* (X~32, Y~0.25)
* (X~42, Y~0.15)
* (X~52, Y~0.10)
* (X~72, Y~0.05)
* (X~102, Y~0.02)
* (X~122, Y~0.01)
* (X~142, Y~0.005)
* (X~162, Y~0.005)
* (X~182, Y~0.005)
* (X~202, Y~0.005)
2. **Purple line (3_shots_and_guided_CoT):**
* **Trend:** This line starts slightly below the 5-shot guided CoT, but very close to the 3-shot unguided CoT. It follows a similar rapid decline pattern, consistently performing slightly worse than the 5-shot guided CoT but generally better than the 1-shot and zero-shot guided CoT.
* **Approximate Data Points (X, Y):**
* (X~12, Y~0.65)
* (X~22, Y~0.43)
* (X~32, Y~0.23)
* (X~42, Y~0.12)
* (X~52, Y~0.08)
* (X~72, Y~0.03)
* (X~102, Y~0.01)
* (X~122, Y~0.005)
* (X~142, Y~0.005)
* (X~162, Y~0.005)
* (X~182, Y~0.005)
* (X~202, Y~0.005)
3. **Orange line (3_shot_unguided):**
* **Trend:** This line starts very close to the 5-shot and 3-shot guided CoT lines. It shows a rapid initial decline, crossing below the 3-shot guided CoT line around X=30-40 actions. For most of the range, it performs better than 1-shot and zero-shot guided CoT, but slightly worse than 3-shot guided CoT.
* **Approximate Data Points (X, Y):**
* (X~12, Y~0.66)
* (X~22, Y~0.42)
* (X~32, Y~0.22)
* (X~42, Y~0.10)
* (X~52, Y~0.07)
* (X~72, Y~0.03)
* (X~102, Y~0.01)
* (X~122, Y~0.005)
* (X~142, Y~0.005)
* (X~162, Y~0.005)
* (X~182, Y~0.005)
* (X~202, Y~0.005)
4. **Red line (1_shot_and_guided_CoT):**
* **Trend:** This line starts with a lower initial success rate compared to the 5-shot and 3-shot configurations. It exhibits a rapid decline, generally performing worse than all 3-shot and 5-shot methods, but slightly better than the zero-shot guided CoT for the initial phase.
* **Approximate Data Points (X, Y):**
* (X~12, Y~0.63)
* (X~22, Y~0.38)
* (X~32, Y~0.20)
* (X~42, Y~0.10)
* (X~52, Y~0.06)
* (X~72, Y~0.02)
* (X~102, Y~0.01)
* (X~122, Y~0.005)
* (X~142, Y~0.005)
* (X~162, Y~0.005)
* (X~182, Y~0.005)
* (X~202, Y~0.005)
5. **Blue line (zero_shot_and_guided_CoT):**
* **Trend:** This line consistently shows the lowest success rate among all configurations, particularly in the initial phase of actions. It follows the same rapid decline pattern as the others, eventually converging to near zero success rate.
* **Approximate Data Points (X, Y):**
* (X~12, Y~0.58)
* (X~22, Y~0.37)
* (X~32, Y~0.18)
* (X~42, Y~0.08)
* (X~52, Y~0.05)
* (X~72, Y~0.02)
* (X~102, Y~0.01)
* (X~122, Y~0.005)
* (X~142, Y~0.005)
* (X~162, Y~0.005)
* (X~182, Y~0.005)
* (X~202, Y~0.005)
### Key Observations
* **Diminishing Returns:** All configurations show a sharp decrease in success rate with an increasing number of actions, indicating that the model's ability to maintain a high success rate diminishes rapidly as more actions are required.
* **Impact of Shots:** For "guided CoT" methods, there is a clear positive correlation between the number of shots and the initial success rate. "5_shots_and_guided_CoT" consistently outperforms "3_shots_and_guided_CoT", which in turn outperforms "1_shot_and_guided_CoT", and "zero_shot_and_guided_CoT".
* **Guided vs. Unguided CoT:** "3_shots_and_guided_CoT" generally performs slightly better than "3_shot_unguided" for the initial actions (up to ~30 actions), but their performance becomes very similar thereafter. This suggests that guidance in CoT might offer a slight advantage at lower action counts but its benefit diminishes quickly.
* **Convergence to Zero:** Beyond approximately 100 actions, the success rates for all configurations converge to very low values (approaching 0.01 or less), suggesting a practical limit to the model's effectiveness for highly complex tasks requiring many actions.
* **Initial Performance Spread:** The largest differences in success rate between the configurations are observed at lower "Number of actions" (e.g., below 50). As the number of actions increases, the performance gap narrows significantly.
### Interpretation
The data suggests that for the "Llama-4-Maverick-17B-128E-Instruct-FP8" model, the "Success rate" is highly sensitive to the "Number of actions" required. This could imply that the model struggles with long-horizon tasks or tasks requiring extensive sequential reasoning, where each action introduces a potential point of failure.
The strong correlation between the number of "shots" and initial success rate for guided CoT methods highlights the importance of few-shot learning in improving the model's performance. Providing more examples (shots) significantly boosts the model's ability to succeed, especially when the task is relatively short (fewer actions).
The comparison between "3_shots_and_guided_CoT" and "3_shot_unguided" indicates that while Chain-of-Thought (CoT) itself is beneficial, explicit guidance might offer a marginal improvement, particularly for tasks with fewer steps. However, this benefit is not sustained for tasks requiring a larger number of actions, where the inherent difficulty of the task likely overshadows the guidance mechanism.
The rapid convergence of all success rates to near zero after a certain number of actions (around 100) points to a fundamental limitation in the model's ability to maintain high accuracy over extended sequences of operations. This could be due to error propagation, increasing complexity, or a lack of robust long-term planning capabilities. For practical applications, this suggests that this model configuration might be more suitable for tasks that can be completed within a relatively small number of actions. Further research might focus on improving the model's robustness for higher action counts or exploring alternative strategies for complex, multi-step problems.
DECODING INTELLIGENCE...