## Line Chart: Llama-4-Maverick-17B-128E-Instruct-FP8 Performance
### Overview
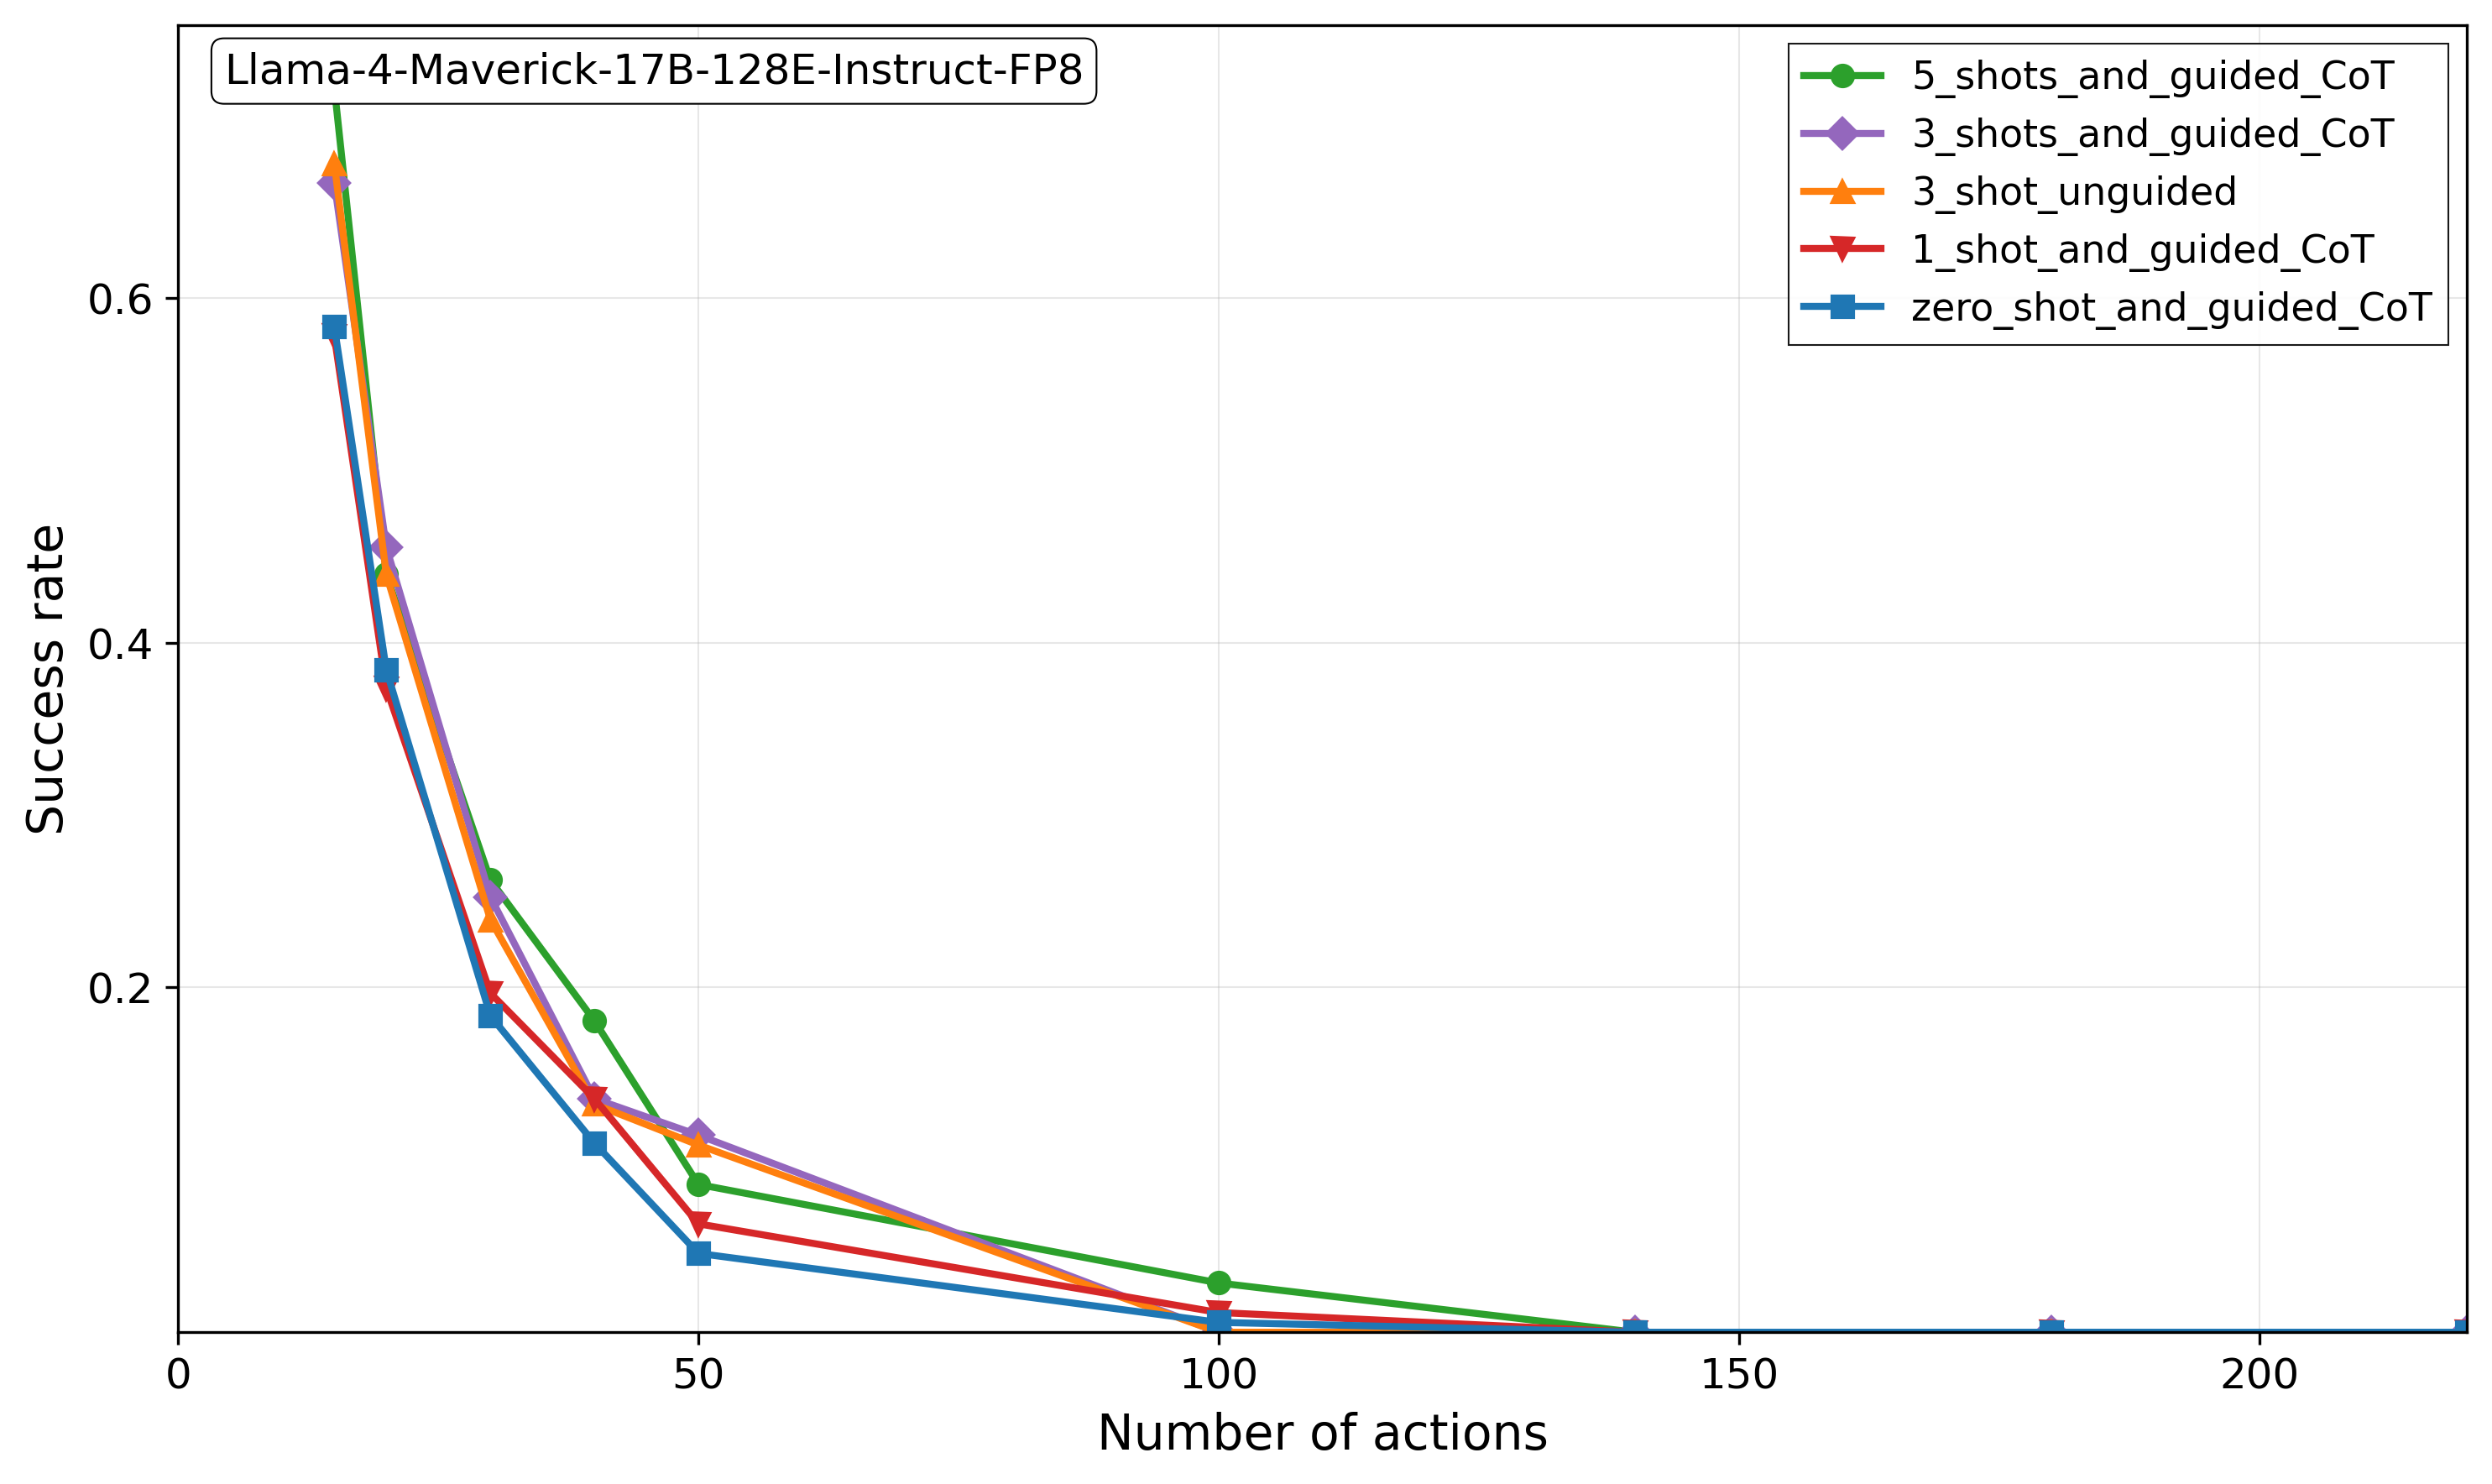
The chart illustrates the success rate of different prompting strategies (shots and guided/unguided Chain of Thought) for the Llama-4-Maverick-17B-128E-Instruct-FP8 model across varying numbers of actions. Success rate declines sharply as the number of actions increases, with distinct patterns for each prompting strategy.
### Components/Axes
- **X-axis**: "Number of actions" (0 to 200, linear scale).
- **Y-axis**: "Success rate" (0 to 0.8, increments of 0.2).
- **Legend**: Located in the top-right corner, with five data series:
- **Green circles**: 5_shots_and_guided_CoT
- **Purple diamonds**: 3_shots_and_guided_CoT
- **Orange triangles**: 3_shot_unguided
- **Red triangles**: 1_shot_and_guided_CoT
- **Blue squares**: zero_shot_and_guided_CoT
### Detailed Analysis
1. **5_shots_and_guided_CoT (Green)**:
- Starts at ~0.75 success rate at 0 actions.
- Drops to ~0.25 at 50 actions, then declines to near 0 by 100 actions.
- Sharpest initial decline among all series.
2. **3_shots_and_guided_CoT (Purple)**:
- Begins at ~0.65 success rate at 0 actions.
- Declines to ~0.15 at 50 actions, then near 0 by 100 actions.
- Slightly less steep decline than the 5-shot guided series.
3. **3_shot_unguided (Orange)**:
- Starts at ~0.6 success rate at 0 actions.
- Drops to ~0.1 at 50 actions, then near 0 by 100 actions.
- Declines faster than 3-shot guided but slower than 5-shot guided.
4. **1_shot_and_guided_CoT (Red)**:
- Begins at ~0.55 success rate at 0 actions.
- Declines to ~0.05 at 50 actions, then near 0 by 100 actions.
- Steeper decline than 3-shot unguided.
5. **zero_shot_and_guided_CoT (Blue)**:
- Starts at ~0.5 success rate at 0 actions.
- Drops to ~0.02 at 50 actions, then near 0 by 100 actions.
- Slowest initial decline but lowest overall performance.
### Key Observations
- **Initial Performance**: Higher-shot guided strategies (5-shot, 3-shot) achieve the highest initial success rates.
- **Decline Rate**: All strategies show rapid success rate decay as actions increase, with guided methods (except zero-shot) maintaining higher rates than unguided.
- **Unguided vs. Guided**: Guided CoT strategies consistently outperform unguided counterparts, even with fewer shots.
- **Zero-Shot Anomaly**: Zero-shot guided CoT starts mid-range but declines sharply, suggesting limited adaptability to complex tasks.
### Interpretation
The data demonstrates that **prompting strategy significantly impacts model performance**, with guided CoT methods (especially higher-shot variants) achieving better initial success. However, **task complexity (number of actions)** universally degrades performance, indicating limitations in handling multi-step reasoning. The zero-shot guided CoT’s mid-range start but steep decline suggests it struggles with tasks requiring iterative refinement. Guided CoT’s structured reasoning likely mitigates performance drops compared to unguided approaches, but even optimal strategies fail to maintain success beyond ~50 actions. This highlights the need for hybrid approaches combining guided reasoning with adaptive task decomposition for complex workflows.