TECHNICAL ASSET FINGERPRINT
29926b62ee854d14b9b96a52
Click to view fullscreen
Press ESC or click to close
FOUND IN PAPERS
EXPERT: gemma-3-27b-it-free VERSION 1
RUNTIME: google-free/gemma-3-27b-it
INTEL_VERIFIED
\n
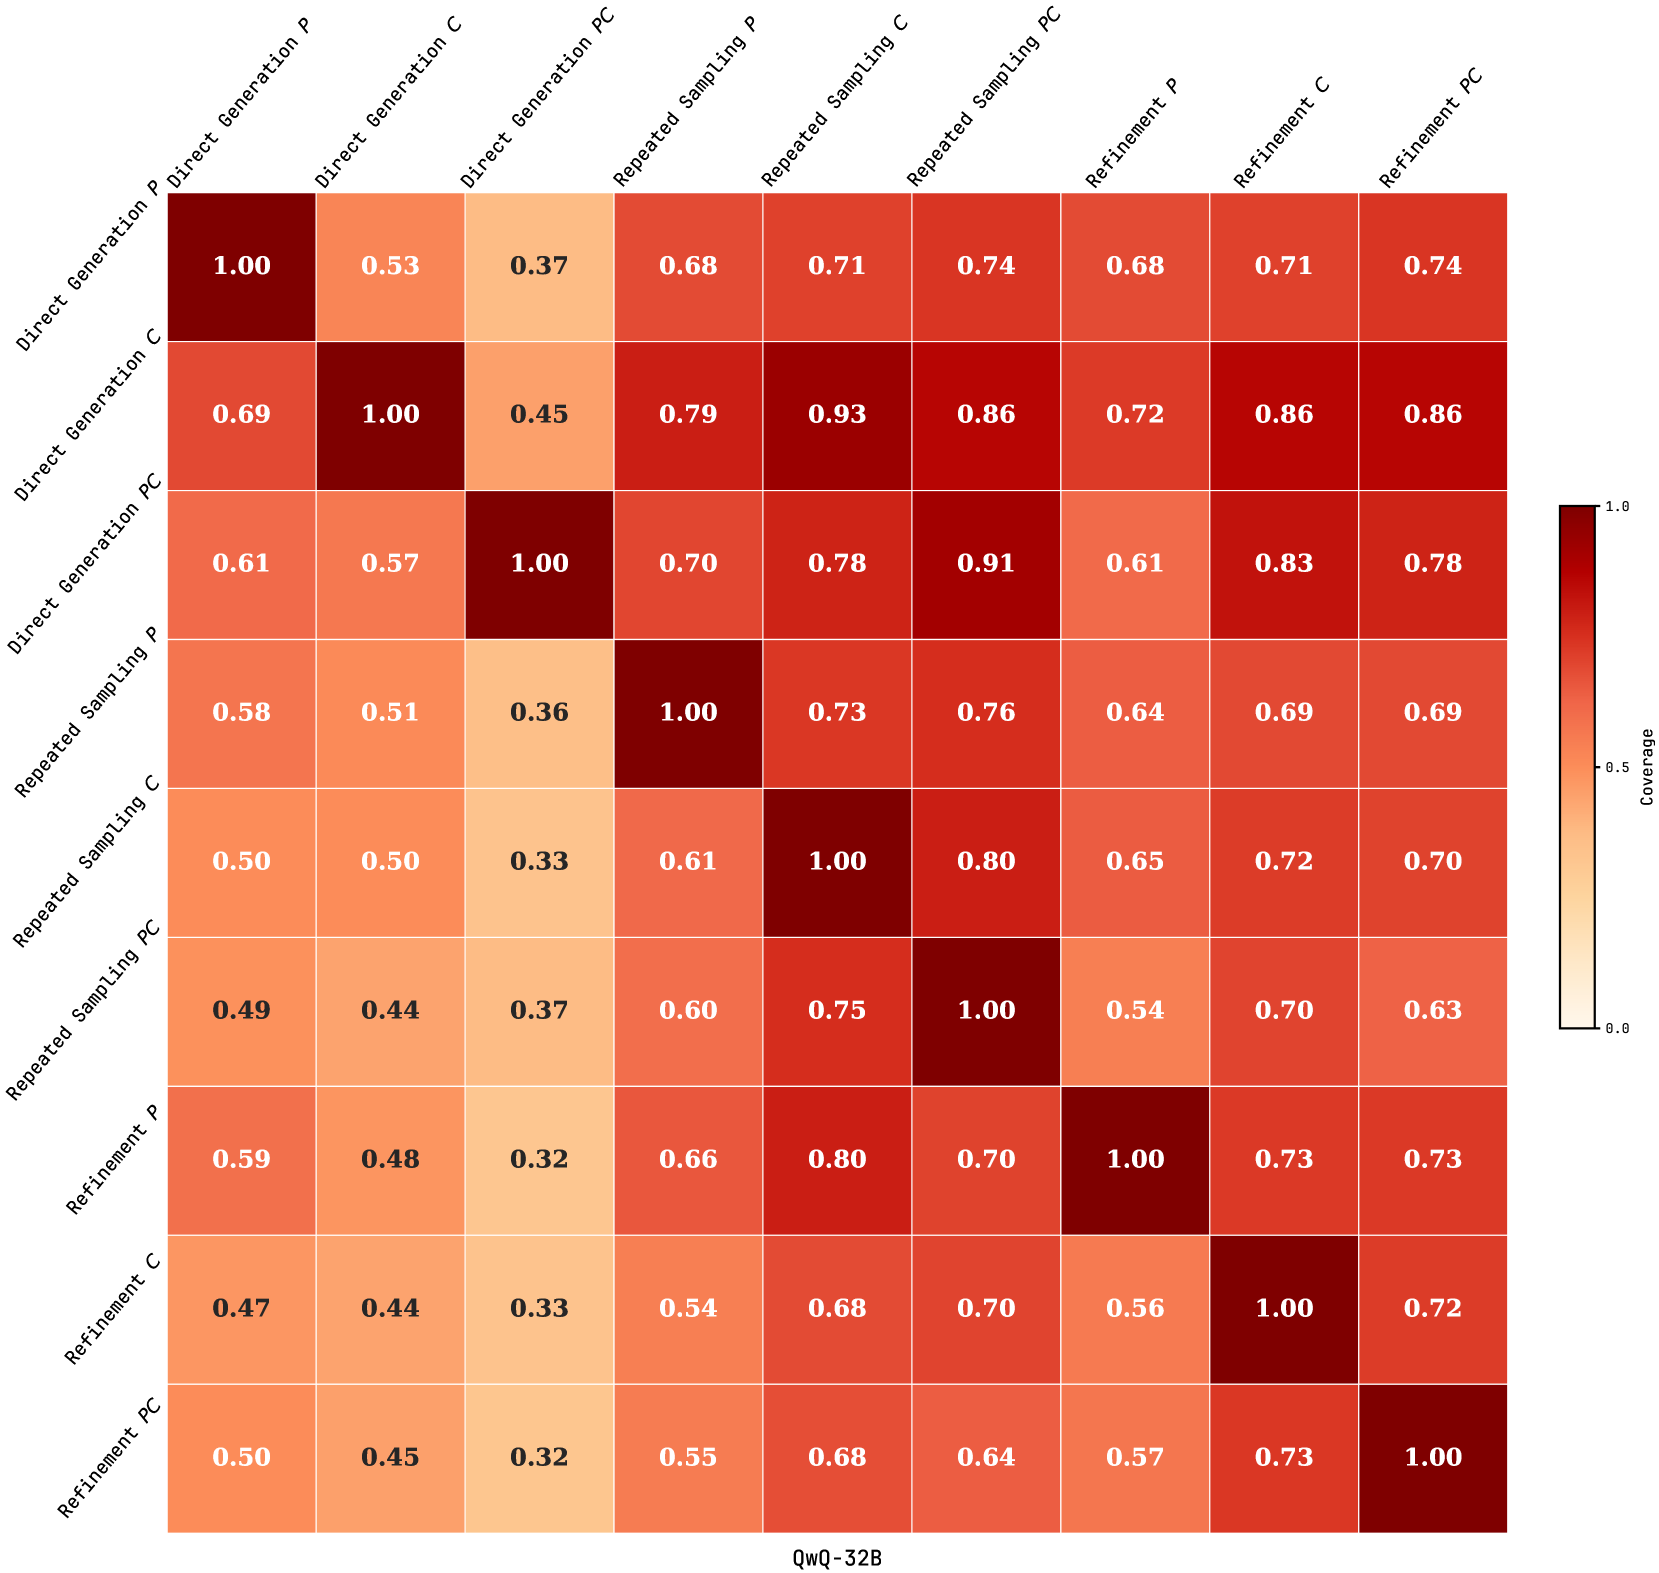
## Heatmap: Correlation Matrix of Sampling Methods
### Overview
This image presents a heatmap displaying a correlation matrix between different sampling methods used in a process. The methods are variations of Direct Generation, Repeated Sampling, and Refinement, each with options for 'P' (presumably a parameter or process) and 'C' (another parameter or process), and 'PC' (potentially a combination). The color intensity represents the correlation coefficient, with a scale ranging from 0.0 to 1.0.
### Components/Axes
* **X-axis:** Lists the sampling methods: "Direct Generation\_P", "Direct Generation\_C", "Direct Generation\_PC", "Repeated Sampling\_P", "Repeated Sampling\_C", "Repeated Sampling\_PC", "Refinement\_P", "Refinement\_C", "Refinement\_PC".
* **Y-axis:** Lists the same sampling methods as the X-axis, creating a square matrix.
* **Color Scale (Right Side):** A vertical color bar indicates the correlation coefficient.
* 0.0 is represented by a light color (almost white).
* 1.0 is represented by a dark red color.
* 0.5 is represented by a mid-tone color.
* **Cell Values:** Each cell in the matrix displays a numerical value representing the correlation coefficient between the corresponding X and Y axis sampling methods.
* **Label (Bottom):** "Qwq-32B" - likely an identifier for the dataset or experiment.
### Detailed Analysis
The heatmap displays correlation coefficients between nine sampling methods. The values range from approximately 0.32 to 1.00. Here's a breakdown of the values, row by row, referencing the color intensity:
* **Direct Generation\_P:**
* Direct Generation\_P: 1.00
* Direct Generation\_C: 0.53
* Direct Generation\_PC: 0.37
* Repeated Sampling\_P: 0.68
* Repeated Sampling\_C: 0.71
* Repeated Sampling\_PC: 0.74
* Refinement\_P: 0.68
* Refinement\_C: 0.71
* Refinement\_PC: 0.74
* **Direct Generation\_C:**
* Direct Generation\_P: 0.69
* Direct Generation\_C: 1.00
* Direct Generation\_PC: 0.45
* Repeated Sampling\_P: 0.79
* Repeated Sampling\_C: 0.93
* Repeated Sampling\_PC: 0.86
* Refinement\_P: 0.72
* Refinement\_C: 0.86
* Refinement\_PC: 0.86
* **Direct Generation\_PC:**
* Direct Generation\_P: 0.61
* Direct Generation\_C: 0.57
* Direct Generation\_PC: 1.00
* Repeated Sampling\_P: 0.70
* Repeated Sampling\_C: 0.78
* Repeated Sampling\_PC: 0.91
* Refinement\_P: 0.61
* Refinement\_C: 0.83
* Refinement\_PC: 0.78
* **Repeated Sampling\_P:**
* Direct Generation\_P: 0.58
* Direct Generation\_C: 0.51
* Direct Generation\_PC: 0.36
* Repeated Sampling\_P: 1.00
* Repeated Sampling\_C: 0.73
* Repeated Sampling\_PC: 0.76
* Refinement\_P: 0.64
* Refinement\_C: 0.69
* Refinement\_PC: 0.69
* **Repeated Sampling\_C:**
* Direct Generation\_P: 0.50
* Direct Generation\_C: 0.50
* Direct Generation\_PC: 0.33
* Repeated Sampling\_P: 0.61
* Repeated Sampling\_C: 1.00
* Repeated Sampling\_PC: 0.80
* Refinement\_P: 0.65
* Refinement\_C: 0.72
* Refinement\_PC: 0.70
* **Repeated Sampling\_PC:**
* Direct Generation\_P: 0.49
* Direct Generation\_C: 0.44
* Direct Generation\_PC: 0.37
* Repeated Sampling\_P: 0.60
* Repeated Sampling\_C: 0.75
* Repeated Sampling\_PC: 1.00
* Refinement\_P: 0.54
* Refinement\_C: 0.70
* Refinement\_PC: 0.63
* **Refinement\_P:**
* Direct Generation\_P: 0.59
* Direct Generation\_C: 0.48
* Direct Generation\_PC: 0.32
* Repeated Sampling\_P: 0.66
* Repeated Sampling\_C: 0.80
* Repeated Sampling\_PC: 0.70
* Refinement\_P: 1.00
* Refinement\_C: 0.73
* Refinement\_PC: 0.73
* **Refinement\_C:**
* Direct Generation\_P: 0.47
* Direct Generation\_C: 0.44
* Direct Generation\_PC: 0.33
* Repeated Sampling\_P: 0.54
* Repeated Sampling\_C: 0.68
* Repeated Sampling\_PC: 0.70
* Refinement\_P: 0.56
* Refinement\_C: 1.00
* Refinement\_PC: 0.72
* **Refinement\_PC:**
* Direct Generation\_P: 0.50
* Direct Generation\_C: 0.45
* Direct Generation\_PC: 0.32
* Repeated Sampling\_P: 0.55
* Repeated Sampling\_C: 0.68
* Repeated Sampling\_PC: 0.64
* Refinement\_P: 0.57
* Refinement\_C: 0.73
* Refinement\_PC: 1.00
### Key Observations
* **Perfect Self-Correlation:** All methods have a correlation of 1.00 with themselves (diagonal elements).
* **Strong Correlation within Method Type:** Within each sampling method type (Direct Generation, Repeated Sampling, Refinement), the 'P', 'C', and 'PC' variations show relatively high correlations, generally above 0.6.
* **Highest Correlations:** The highest correlations (excluding self-correlation) are observed between "Direct Generation\_C" and "Repeated Sampling\_C" (0.93), and between "Direct Generation\_PC" and "Repeated Sampling\_PC" (0.91).
* **Lowest Correlations:** The lowest correlations are generally found between the 'PC' variations of different methods (e.g., Direct Generation\_PC and Repeated Sampling\_P, 0.36).
* **Symmetry:** The matrix is symmetrical, indicating that the correlation between method A and method B is the same as between method B and method A.
### Interpretation
This correlation matrix suggests that the different sampling methods are related, but not perfectly interchangeable. The strong correlations within each method type (Direct, Repeated, Refinement) indicate that the 'P', 'C', and 'PC' variations are capturing similar information. The higher correlations between 'C' variations suggest that the 'C' parameter or process is a dominant factor in determining the similarity between these methods.
The lower correlations between 'PC' variations of different methods suggest that the combination of 'P' and 'C' introduces more diversity in the sampling process, leading to less overlap in the information captured. The dataset identifier "Qwq-32B" implies this data is from a specific model or experiment, and the correlations observed are specific to that context.
The heatmap provides valuable insights into the relationships between these sampling methods, which can be used to inform decisions about which methods to use in combination or to select the most appropriate method for a given task. Further investigation could explore the meaning of the 'P' and 'C' parameters to understand why certain correlations are stronger than others.
DECODING INTELLIGENCE...