## Diagram: Speaker Constraints and Interaction Zones
### Overview
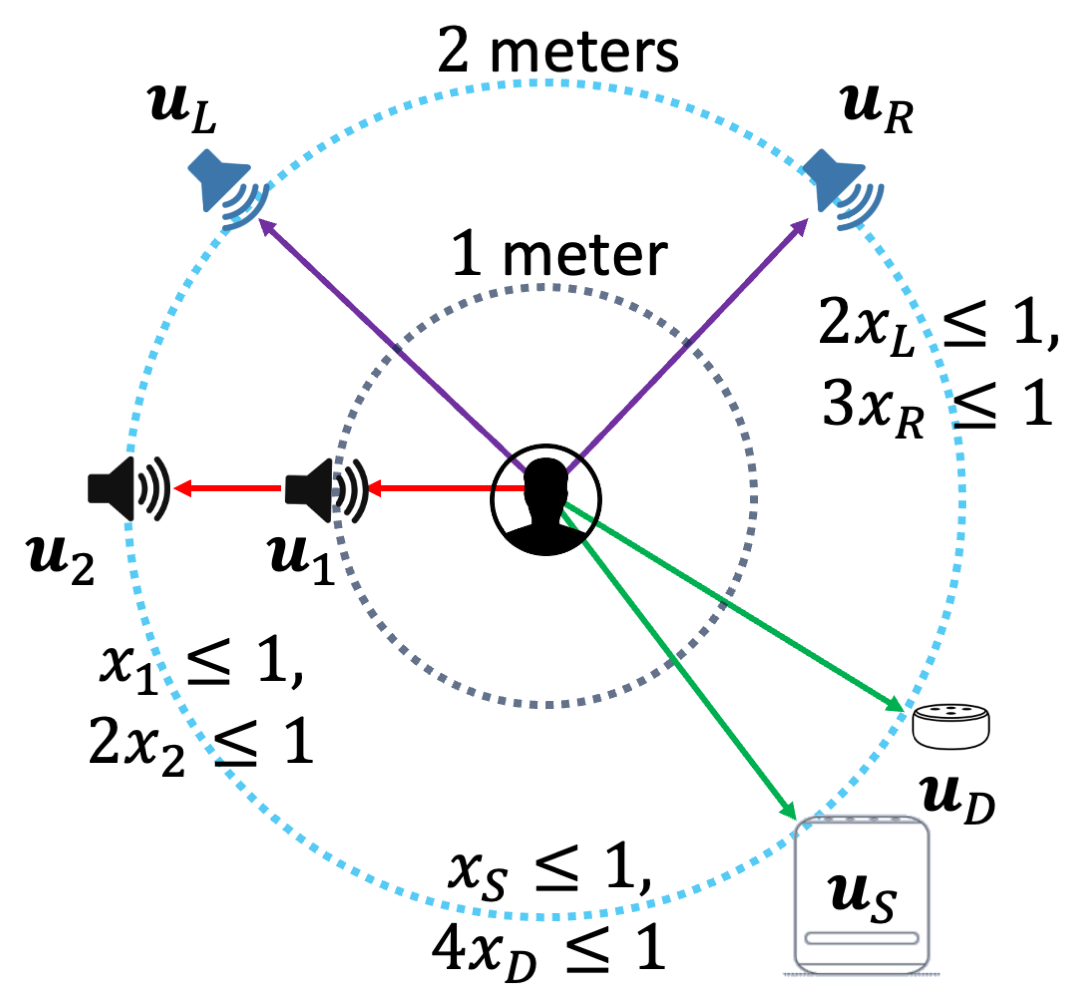
The diagram illustrates a central figure (likely a listener or device) surrounded by concentric interaction zones and multiple speakers (u_L, u_R, u_1, u_2, u_D, u_S). Each speaker is connected to the central figure via colored lines with mathematical constraints. The layout suggests a spatial model of sound propagation, interaction limits, or signal strength thresholds.
### Components/Axes
- **Central Figure**: Positioned at the center, representing the listener/device.
- **Concentric Circles**:
- Inner circle labeled "1 meter" (gray dashed line).
- Outer circle labeled "2 meters" (blue dotted line).
- **Speakers**:
- **u_L**: Top-left, connected by a purple line with constraints:
`2x_L ≤ 1`, `3x_R ≤ 1`.
- **u_R**: Top-right, connected by a purple line with constraints:
`2x_L ≤ 1`, `3x_R ≤ 1`.
- **u_1**: Left-middle, connected by a red line with constraints:
`x_1 ≤ 1`, `2x_2 ≤ 1`.
- **u_2**: Left-middle, connected by a red line with constraints:
`x_1 ≤ 1`, `2x_2 ≤ 1`.
- **u_D**: Bottom-right, connected by a green line with constraints:
`x_S ≤ 1`, `4x_D ≤ 1`.
- **u_S**: Bottom-right, connected by a green line with constraints:
`x_S ≤ 1`, `4x_D ≤ 1`.
- **Lines**: Colored lines (purple, red, green) connect speakers to the central figure, likely representing signal paths or interaction ranges.
### Detailed Analysis
- **Constraints**:
- Purple lines (u_L, u_R): Constraints involve `x_L` and `x_R`, possibly representing left/right signal balance or intensity limits.
- Red lines (u_1, u_2): Constraints involve `x_1` and `x_2`, potentially denoting front/back or primary/secondary speaker roles.
- Green lines (u_D, u_S): Constraints involve `x_S` and `x_D`, possibly distinguishing between direct and secondary sound sources.
- **Spatial Relationships**:
- Speakers u_L and u_R are positioned at the outer 2-meter circle, while u_1, u_2, u_D, and u_S are closer (within 1 meter).
- The central figure is equidistant from all speakers, suggesting a symmetrical interaction model.
### Key Observations
1. **Constraint Variability**: Each speaker has unique constraints, implying different operational limits or roles.
2. **Color Coding**: Purple, red, and green lines may categorize speakers by function (e.g., primary, auxiliary, directional).
3. **Distance Zones**: The 1-meter and 2-meter circles likely define interaction ranges for different speaker types.
### Interpretation
The diagram models a system where the central figure interacts with multiple speakers under specific constraints. The inequalities (e.g., `2x_L ≤ 1`) likely represent normalized parameters such as:
- **Signal strength**: Limits on maximum allowable values (e.g., volume, power).
- **Spatial prioritization**: Weighting of speakers based on proximity or direction.
- **System stability**: Conditions to prevent interference or overload.
The concentric circles and color-coded lines suggest a hierarchical or zoned interaction model, where speakers closer to the central figure (1-meter zone) have stricter constraints (e.g., `4x_D ≤ 1` for u_D). This could reflect a prioritization of direct sound sources (u_D, u_S) over ambient ones (u_L, u_R). The absence of a legend requires inferring color meanings from constraint patterns, but the spatial and mathematical relationships provide a clear framework for understanding the system's design.