## Diagram: Audio Source and Listener Setup
### Overview
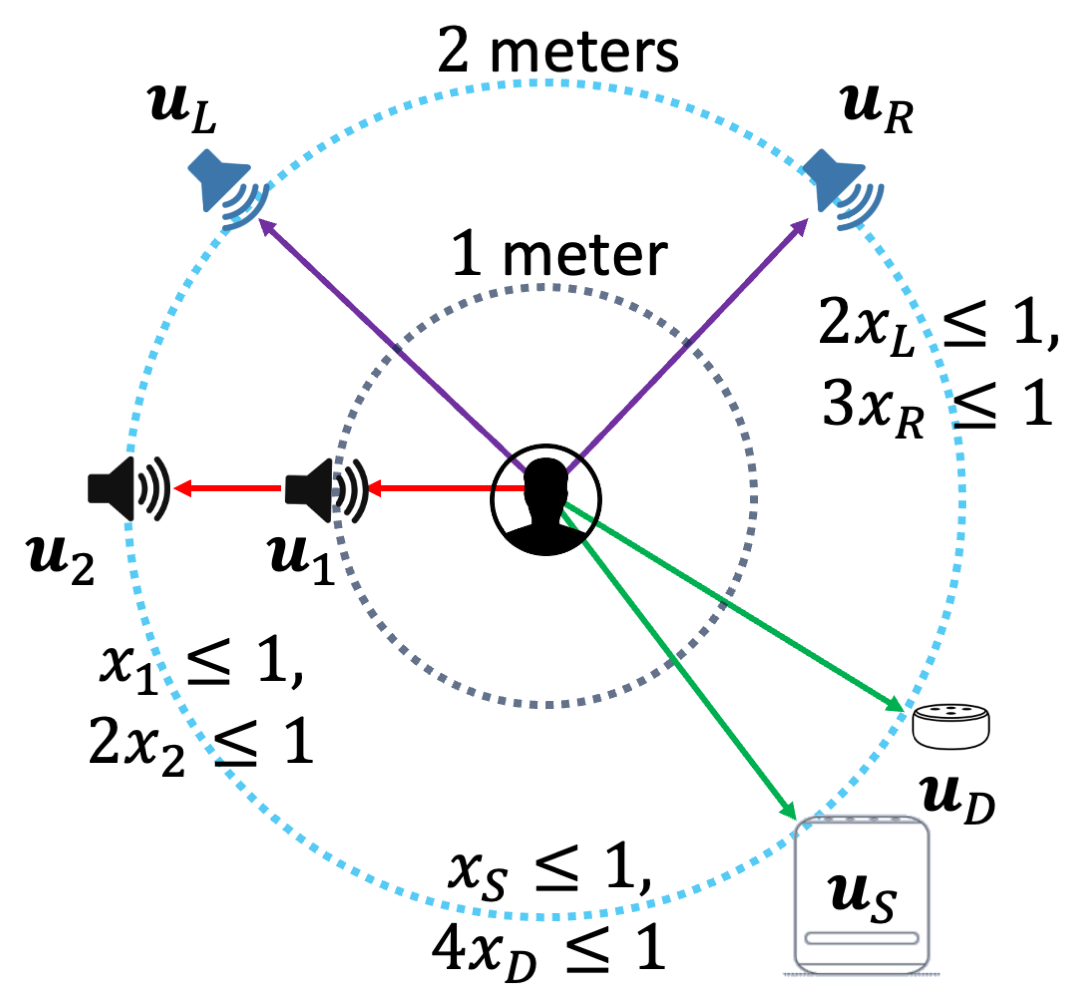
The image is a diagram illustrating the spatial arrangement of audio sources and a listener. It depicts a person (listener) at the center, surrounded by several audio sources (speakers, devices) positioned at varying distances and angles. The diagram includes distance markers and inequalities related to the positions.
### Components/Axes
* **Listener:** Represented by a black silhouette of a person's head and shoulders at the center of the diagram.
* **Audio Sources:**
* `uL`: Speaker icon, located at the top-left, on the outer circle.
* `uR`: Speaker icon, located at the top-right, on the outer circle.
* `u1`: Speaker icon, located on the left, on the inner circle.
* `u2`: Speaker icon, located to the left of `u1`, on the outer circle.
* `uD`: Device icon (circular), located at the bottom-right, on the outer circle.
* `uS`: Device icon (rectangular), located below `uD`, outside the outer circle.
* **Distance Markers:**
* Inner dotted circle: Labeled "1 meter".
* Outer dotted circle: Labeled "2 meters".
* **Lines:**
* Purple lines: Connect the listener to `uL` and `uR`.
* Red line: Connects the listener to `u1` and `u2`.
* Green lines: Connect the listener to `uD` and `uS`.
* **Inequalities:**
* Near `u2`: "x1 ≤ 1, 2x2 ≤ 1"
* Near `uR`: "2xL ≤ 1, 3xR ≤ 1"
* Near `uS`: "xS ≤ 1, 4xD ≤ 1"
### Detailed Analysis
* **Audio Source Positions:**
* `uL` and `uR` are positioned on the outer circle (2 meters from the listener) at approximately 45 degrees from the vertical axis.
* `u1` is positioned on the inner circle (1 meter from the listener) on the left side.
* `u2` is positioned on the outer circle (2 meters from the listener) to the left of `u1`.
* `uD` is positioned on the outer circle (2 meters from the listener) on the bottom-right.
* `uS` is positioned outside the outer circle, below `uD`.
* **Lines:**
* The purple lines indicate the distance and direction from the listener to `uL` and `uR`.
* The red line indicates the distance and direction from the listener to `u1` and `u2`.
* The green lines indicate the distance and direction from the listener to `uD` and `uS`.
* **Inequalities:**
* "x1 ≤ 1, 2x2 ≤ 1": Relates to the positions of `u1` and `u2`.
* "2xL ≤ 1, 3xR ≤ 1": Relates to the positions of `uL` and `uR`.
* "xS ≤ 1, 4xD ≤ 1": Relates to the positions of `uS` and `uD`.
### Key Observations
* The listener is centrally located.
* Audio sources are positioned at different distances and angles around the listener.
* The inequalities provide constraints on the positions of the audio sources.
### Interpretation
The diagram illustrates a spatial audio setup, likely for research or engineering purposes. The listener is at the center, and the audio sources are positioned around them to create a specific sound field. The inequalities likely represent constraints or design parameters for the audio setup, possibly related to sound intensity, delay, or other acoustic properties. The diagram could be used to analyze or design spatial audio systems, such as those used in virtual reality, augmented reality, or sound localization applications. The different colors of the lines connecting the listener to the audio sources may represent different audio channels or signal paths.