\n
## Diagram: Spatial Audio Setup
### Overview
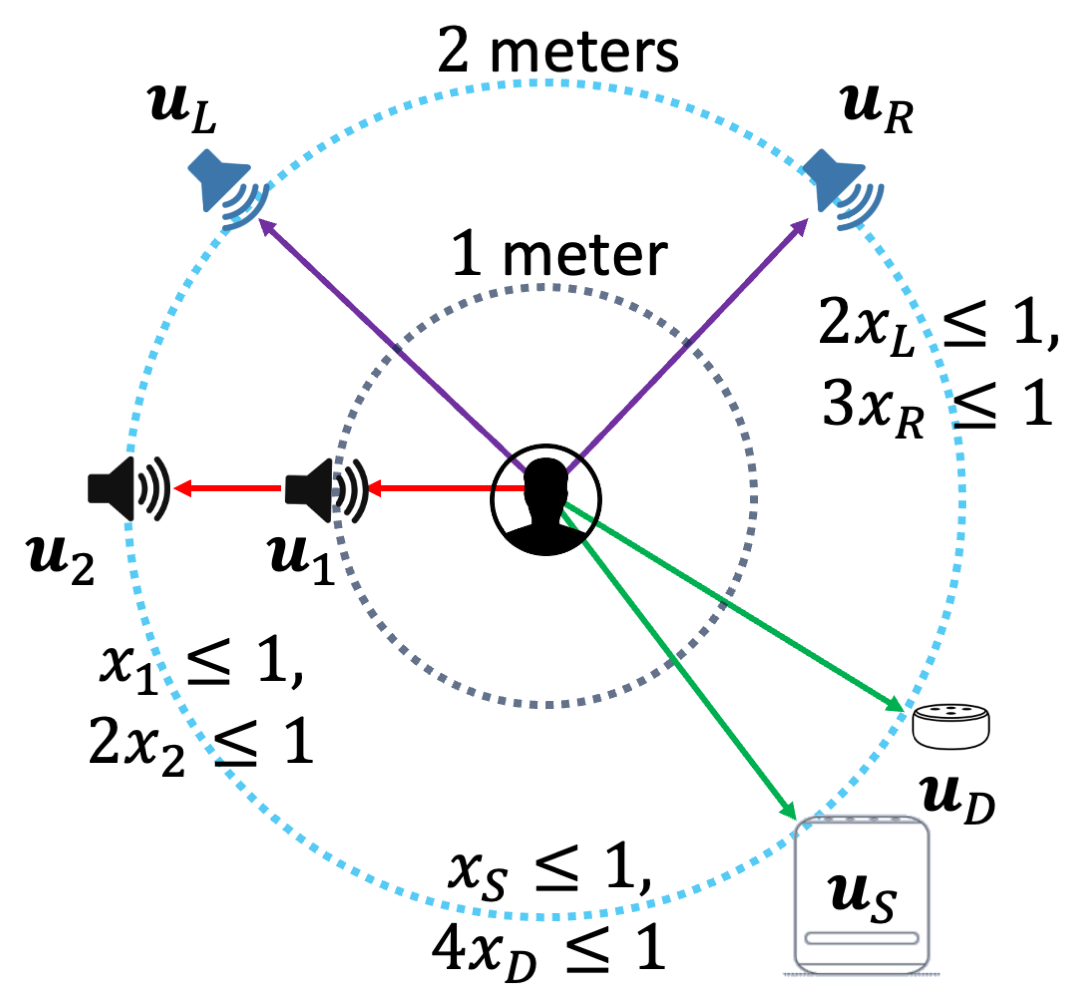
The image depicts a diagram illustrating a spatial audio setup with a listener surrounded by multiple audio sources. The diagram shows the relative positions of speakers and constraints on their distances to the listener. It appears to be a schematic representation for a sound localization or virtual reality application.
### Components/Axes
The diagram features:
* **Listener:** Represented by a silhouette of a head in the center.
* **Audio Sources:**
* `u1`: A speaker positioned directly in front of the listener (red arrow).
* `u2`: A speaker positioned to the left of the listener (orange arrow).
* `uL`: A speaker positioned above and to the left of the listener (purple arrow).
* `uR`: A speaker positioned above and to the right of the listener (blue arrow).
* `uD`: A speaker positioned below the listener (grey arrow).
* `uS`: A speaker positioned to the right and below the listener (green arrow).
* **Distance Constraints:** Mathematical inequalities are associated with each audio source, limiting their distance from the listener.
* **Concentric Circles:** Two concentric circles are drawn around the listener, indicating distances of 1 meter and 2 meters.
* **Dotted Circle:** A dotted circle is drawn around the listener, indicating a distance of 1 meter.
### Detailed Analysis or Content Details
The diagram defines spatial constraints for each audio source:
* **u1:** `x1 ≤ 1`, `2x2 ≤ 1`
* **u2:** No explicit constraint is shown.
* **uL:** `2xL ≤ 1`
* **uR:** `3xR ≤ 1`
* **uD:** `xS ≤ 1`, `4xD ≤ 1`
* **uS:** No explicit constraint is shown.
The distances from the listener are indicated by the concentric circles:
* The inner dotted circle represents a radius of 1 meter.
* The outer dotted circle represents a radius of 2 meters.
The arrows indicate the direction of the sound source relative to the listener. The red arrow (u1) points directly forward. The orange arrow (u2) points to the left. The purple arrow (uL) points up and to the left. The blue arrow (uR) points up and to the right. The grey arrow (uD) points down. The green arrow (uS) points down and to the right.
### Key Observations
* The constraints on the audio sources suggest a limitation on their maximum distance from the listener.
* The constraints are not uniform across all sources. For example, `uR` has a stricter constraint (`3xR ≤ 1`) than `uL` (`2xL ≤ 1`).
* The diagram focuses on the relative positioning of the audio sources and their distance from the listener, rather than absolute coordinates.
* The constraints appear to be related to the perceived spatial location of the sound sources.
### Interpretation
This diagram likely represents a simplified model for spatial audio rendering or sound localization. The constraints on the audio source distances are likely intended to ensure that the sound sources are perceived as being within a reasonable range for a realistic spatial audio experience. The different constraints for different speakers could be related to their intended role in the sound field (e.g., front speakers might have different constraints than surround speakers). The concentric circles provide a visual reference for the distances involved. The diagram suggests a system where the audio sources are positioned strategically around the listener to create a convincing 3D soundscape. The mathematical constraints are likely used in an algorithm to determine the appropriate volume and delay for each audio source to achieve the desired spatial effect. The diagram does not provide any information about the frequency content of the sounds or the characteristics of the speakers themselves.