## Line Chart: Accuracy vs. Training Steps for Different Loop Families
### Overview
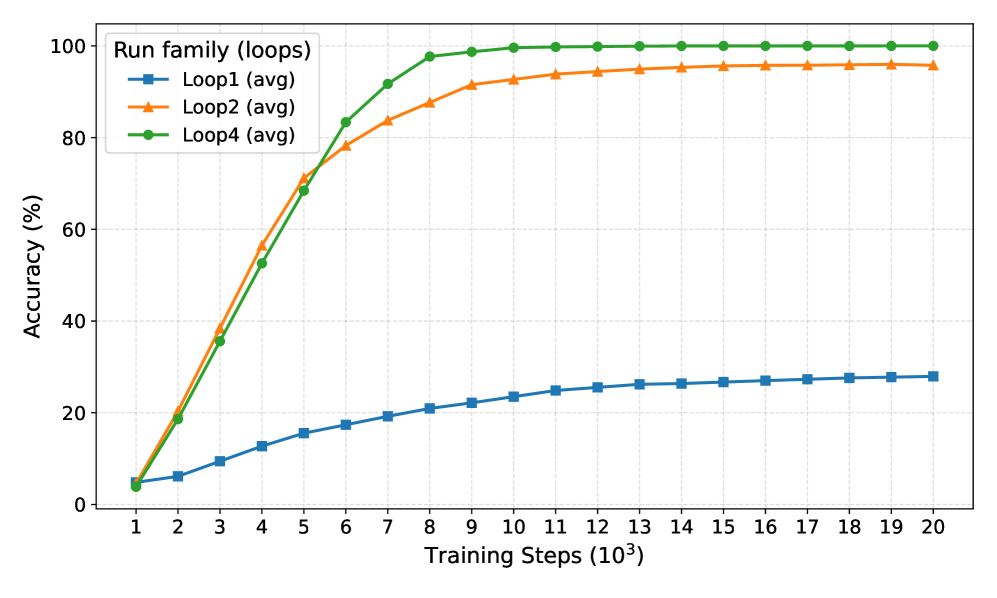
The image is a line chart comparing the accuracy of three different loop families (Loop1, Loop2, and Loop4) as a function of training steps. The x-axis represents training steps in thousands, ranging from 1 to 20. The y-axis represents accuracy in percentage, ranging from 0 to 100. The chart displays how the accuracy of each loop family changes with increasing training steps.
### Components/Axes
* **Title:** There is no explicit title on the chart.
* **X-axis:**
* Label: "Training Steps (10³)"
* Scale: 1 to 20, with integer increments.
* **Y-axis:**
* Label: "Accuracy (%)"
* Scale: 0 to 100, with increments of 20.
* **Legend:** Located in the top-left corner of the chart.
* "Run family (loops)"
* Loop1 (avg) - Blue line with square markers
* Loop2 (avg) - Orange line with triangle markers
* Loop4 (avg) - Green line with circle markers
* **Grid:** Light gray dashed lines forming a grid.
### Detailed Analysis
* **Loop1 (avg):** (Blue line with square markers)
* Trend: The accuracy increases slowly with training steps and plateaus at a relatively low accuracy.
* Data Points:
* At 1 training step: ~4%
* At 5 training steps: ~15%
* At 10 training steps: ~23%
* At 20 training steps: ~27%
* **Loop2 (avg):** (Orange line with triangle markers)
* Trend: The accuracy increases rapidly initially, then the rate of increase slows down, approaching a plateau.
* Data Points:
* At 1 training step: ~4%
* At 5 training steps: ~55%
* At 10 training steps: ~92%
* At 20 training steps: ~96%
* **Loop4 (avg):** (Green line with circle markers)
* Trend: The accuracy increases rapidly initially, then the rate of increase slows down, approaching a plateau.
* Data Points:
* At 1 training step: ~4%
* At 5 training steps: ~53%
* At 10 training steps: ~99%
* At 20 training steps: ~99%
### Key Observations
* Loop2 and Loop4 achieve significantly higher accuracy than Loop1.
* Loop2 and Loop4 show a similar trend, with rapid initial increase in accuracy followed by a plateau.
* Loop1's accuracy increases very slowly and plateaus at a much lower level compared to the other two.
* The accuracy of Loop4 appears to plateau at a slightly higher level than Loop2.
### Interpretation
The chart demonstrates the performance of different loop families in terms of accuracy as a function of training steps. Loop1 performs significantly worse than Loop2 and Loop4, suggesting it may have limitations in its design or implementation. Loop2 and Loop4 exhibit similar learning curves, but Loop4 achieves slightly higher accuracy, indicating it may be the most effective loop family among the three. The plateauing of accuracy for Loop2 and Loop4 suggests that increasing training steps beyond a certain point may not significantly improve performance. The data suggests that Loop4 is the most effective loop family, reaching near-perfect accuracy with sufficient training.