## Vertical Bar Chart: Count of Domains in Fact-Checking/Misinformation Research
### Overview
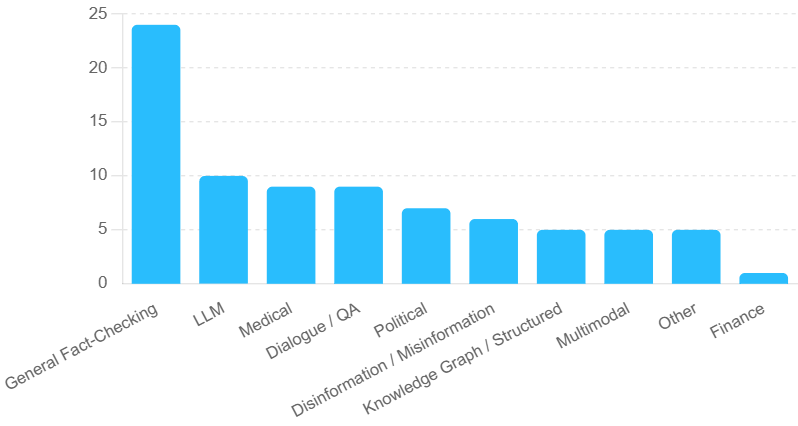
This is a vertical bar chart displaying the frequency or count of various domains or categories, likely related to research areas in fact-checking, misinformation, or large language model (LLM) applications. The chart features a series of blue bars against a light gray background with horizontal grid lines.
### Components/Axes
* **Chart Type:** Vertical Bar Chart.
* **Y-Axis:**
* **Title:** "Count" (implied by the numerical scale; the axis label itself is not explicitly written but is standard for such charts).
* **Scale:** Linear scale from 0 to 25.
* **Major Tick Marks:** 0, 5, 10, 15, 20, 25.
* **X-Axis:**
* **Categories (from left to right):**
1. General Fact-Checking
2. LLM
3. Medical
4. Dialogue / QA
5. Political
6. Disinformation / Misinformation
7. Knowledge Graph / Structured
8. Multimodal
9. Other
10. Finance
* **Legend:** Not present. The chart represents a single data series.
* **Visual Style:** All bars are a uniform bright blue color. The background is light gray with faint, dashed horizontal grid lines aligned with the y-axis tick marks.
### Detailed Analysis
The following table reconstructs the data presented in the chart. Values are approximate, estimated based on the height of each bar relative to the y-axis grid lines.
| Category (X-Axis) | Approximate Count (Y-Axis) | Visual Trend & Placement |
| :--- | :--- | :--- |
| General Fact-Checking | ~24 | The tallest bar, located at the far left. Its top is just below the 25 grid line. |
| LLM | ~10 | The second bar. Its top aligns exactly with the 10 grid line. |
| Medical | ~9 | The third bar. Slightly shorter than the "LLM" bar. |
| Dialogue / QA | ~9 | The fourth bar. Appears to be the same height as the "Medical" bar. |
| Political | ~7 | The fifth bar. Its top is between the 5 and 10 grid lines, closer to 5. |
| Disinformation / Misinformation | ~6 | The sixth bar. Slightly shorter than the "Political" bar. |
| Knowledge Graph / Structured | ~5 | The seventh bar. Its top aligns exactly with the 5 grid line. |
| Multimodal | ~5 | The eighth bar. Same height as the "Knowledge Graph / Structured" bar. |
| Other | ~5 | The ninth bar. Same height as the previous two bars. |
| Finance | ~1 | The tenth and final bar, located at the far right. The shortest bar, just above the 0 line. |
**Trend Verification:** The data series shows a clear descending trend from left to right. The first category ("General Fact-Checking") is a significant outlier with a much higher count. After the initial drop, the values plateau in the middle range (categories 7-9 all at ~5) before a final drop for "Finance."
### Key Observations
1. **Dominant Category:** "General Fact-Checking" is the most prominent domain by a large margin, with a count (~24) more than double that of the next highest category.
2. **Secondary Tier:** "LLM," "Medical," and "Dialogue / QA" form a secondary cluster with counts around 9-10.
3. **Plateau:** There is a distinct plateau in the latter half of the chart, where "Knowledge Graph / Structured," "Multimodal," and "Other" all share the same approximate count of 5.
4. **Lowest Representation:** "Finance" is the least represented category in this dataset.
5. **Visual Grouping:** The categories are not sorted in strict descending order (e.g., "Medical" and "Dialogue / QA" are equal, breaking a perfect descending sequence).
### Interpretation
This chart likely visualizes the distribution of research papers, datasets, or projects across different application domains within a specific corpus related to information verification or AI safety. The overwhelming dominance of "General Fact-Checking" suggests that the foundational or broad-spectrum approaches to fact verification are the most heavily studied or represented area in this context. The significant presence of "LLM" indicates a strong focus on the role of large language models in this field. The plateau at a count of 5 for several specialized domains (Knowledge Graphs, Multimodal) suggests these are established but less central research niches. The very low count for "Finance" could imply that financial fact-checking is either a highly specialized sub-field with less overall volume or is categorized differently within the source data. The chart effectively communicates a research landscape where general methods are primary, with specific technological (LLM) and topical (Medical, Political) applications forming important secondary areas of focus.