## Bar Chart: Distribution of AI Model Performance Across Different Tasks
### Overview
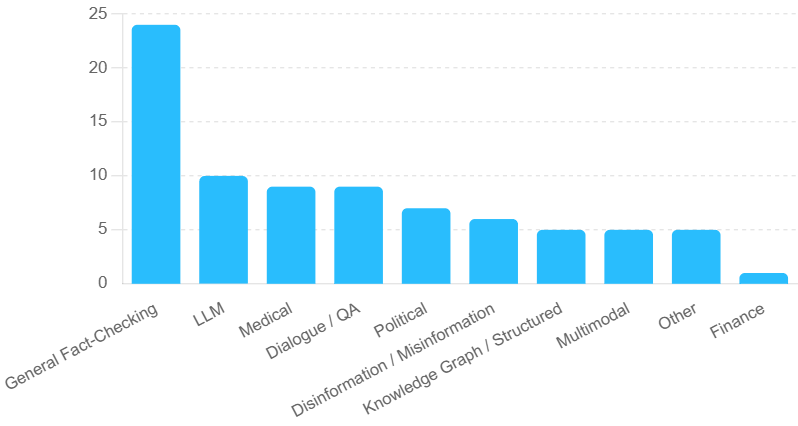
The chart visualizes the distribution of AI model performance across 11 distinct task categories. The y-axis represents the "Number of Tasks" (0–25), while the x-axis lists task categories. Bars are uniformly blue, with no explicit legend. The tallest bar corresponds to "General Fact-Checking," followed by a steep decline in performance metrics for subsequent categories.
### Components/Axes
- **X-Axis (Categories)**:
General Fact-Checking, LLM, Medical, Dialogue / QA, Political, Disinformation / Misinformation, Knowledge Graph / Structured, Multimodal, Other, Finance.
- **Y-Axis (Values)**:
Labeled "Number of Tasks" with increments of 5 (0–25).
- **Bars**:
All bars are blue, with heights proportional to task counts. No legend is visible, but the uniform color suggests a single data series.
### Detailed Analysis
- **General Fact-Checking**: Approximately 24 tasks (tallest bar, ~23–25 range).
- **LLM**: ~10 tasks (second tallest, ~9–11 range).
- **Medical**: ~9 tasks (tied with Dialogue / QA).
- **Dialogue / QA**: ~9 tasks (tied with Medical).
- **Political**: ~7 tasks (~6–8 range).
- **Disinformation / Misinformation**: ~6 tasks (~5–7 range).
- **Knowledge Graph / Structured**: ~5 tasks (~4–6 range).
- **Multimodal**: ~5 tasks (~4–6 range).
- **Other**: ~5 tasks (~4–6 range).
- **Finance**: ~1 task (shortest bar, ~0–2 range).
### Key Observations
1. **Dominance of General Fact-Checking**: The category "General Fact-Checking" outperforms all others by a margin of ~15 tasks, suggesting it is either a prioritized or well-developed area.
2. **Mid-Range Clustering**: "LLM," "Medical," and "Dialogue / QA" form a mid-tier group with ~9–10 tasks each, indicating moderate performance.
3. **Lower-Tier Categories**: "Political," "Disinformation / Misinformation," and "Knowledge Graph / Structured" cluster between 5–7 tasks, reflecting weaker performance.
4. **Finance as Outlier**: "Finance" has the lowest count (~1 task), highlighting a significant gap in model capability for this domain.
### Interpretation
The data suggests AI models excel at **General Fact-Checking** tasks, likely due to their foundational nature in training datasets. The mid-tier performance in "LLM," "Medical," and "Dialogue / QA" implies these areas are moderately addressed, possibly through specialized fine-tuning. The low performance in "Finance" and "Other" may indicate underrepresentation in training data or inherent complexity. The clustering of "Disinformation / Misinformation" and "Knowledge Graph / Structured" tasks hints at challenges in handling adversarial or structured data. Overall, the chart underscores the need for targeted improvements in underperforming domains to achieve balanced AI capabilities.