# Technical Document Extraction: Entity Frequency Analysis
## Chart Description
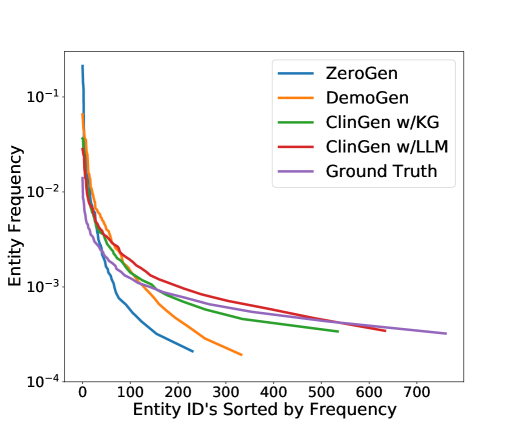
The image is a **line chart** comparing the frequency distribution of entities across different generation models. The chart uses a **logarithmic scale** on the y-axis to represent entity frequency, while the x-axis represents entity IDs sorted by frequency.
---
### **Axis Labels and Markers**
- **Y-Axis**:
- Title: `Entity Frequency`
- Scale: Logarithmic (10⁻⁴ to 10⁻¹)
- Tick Marks: 10⁻¹, 10⁻², 10⁻³, 10⁻⁴
- **X-Axis**:
- Title: `Entity ID's Sorted by Frequency`
- Range: 0 to 700 (linear scale)
---
### **Legend and Line Data**
The chart includes five distinct lines, each representing a model or baseline. Colors and labels are cross-referenced for accuracy:
| **Line Color** | **Label** | **Key Observations** |
|----------------|-------------------------|--------------------------------------------------------------------------------------|
| Blue | ZeroGen | Steepest initial decline; drops below 10⁻³ by x ≈ 200. |
| Orange | DemoGen | Rapid decline; intersects ZeroGen at x ≈ 100, then diverges. Drops below 10⁻³ by x ≈ 300. |
| Green | ClinGen w/KG | Moderate decline; remains above DemoGen until x ≈ 200. Drops below 10⁻³ by x ≈ 400. |
| Red | ClinGen w/LLM | Closest to Ground Truth; intersects it at x ≈ 500. Declines gradually. |
| Purple | Ground Truth | Baseline; serves as reference. Declines slowly, remaining above 10⁻³ until x ≈ 600. |
---
### **Key Trends**
1. **Initial Divergence**:
- All lines start near 10⁻¹ at x = 0 but diverge sharply within the first 100 entity IDs.
- ZeroGen and DemoGen exhibit the steepest declines, while ClinGen variants and Ground Truth decline more gradually.
2. **Convergence at Higher Frequencies**:
- By x ≈ 500, ClinGen w/LLM aligns closely with Ground Truth.
- ZeroGen and DemoGen fall far below Ground Truth, indicating lower performance for rare entities.
3. **Logarithmic Scale Impact**:
- The y-axis compression emphasizes differences in frequency magnitude, particularly for rare entities (x > 300).
---
### **Critical Notes**
- **Ground Truth** is the reference baseline; all models are evaluated against it.
- **ClinGen w/LLM** demonstrates the highest fidelity to Ground Truth across most entity frequencies.
- **ZeroGen** and **DemoGen** underperform for low-frequency entities (x > 200), with frequencies dropping below 10⁻³.
---
### **Data Extraction Summary**
- **No embedded data tables** or numerical values are explicitly provided in the chart.
- All insights are derived from line trajectories and logarithmic scale interpretation.
- Cross-referenced legend labels confirm color-line correspondence.
This chart highlights trade-offs between model performance and entity frequency, with ClinGen w/LLM showing the strongest alignment with empirical data.