## Diagram: COCONUT Probabilistic Model Visualization
### Overview
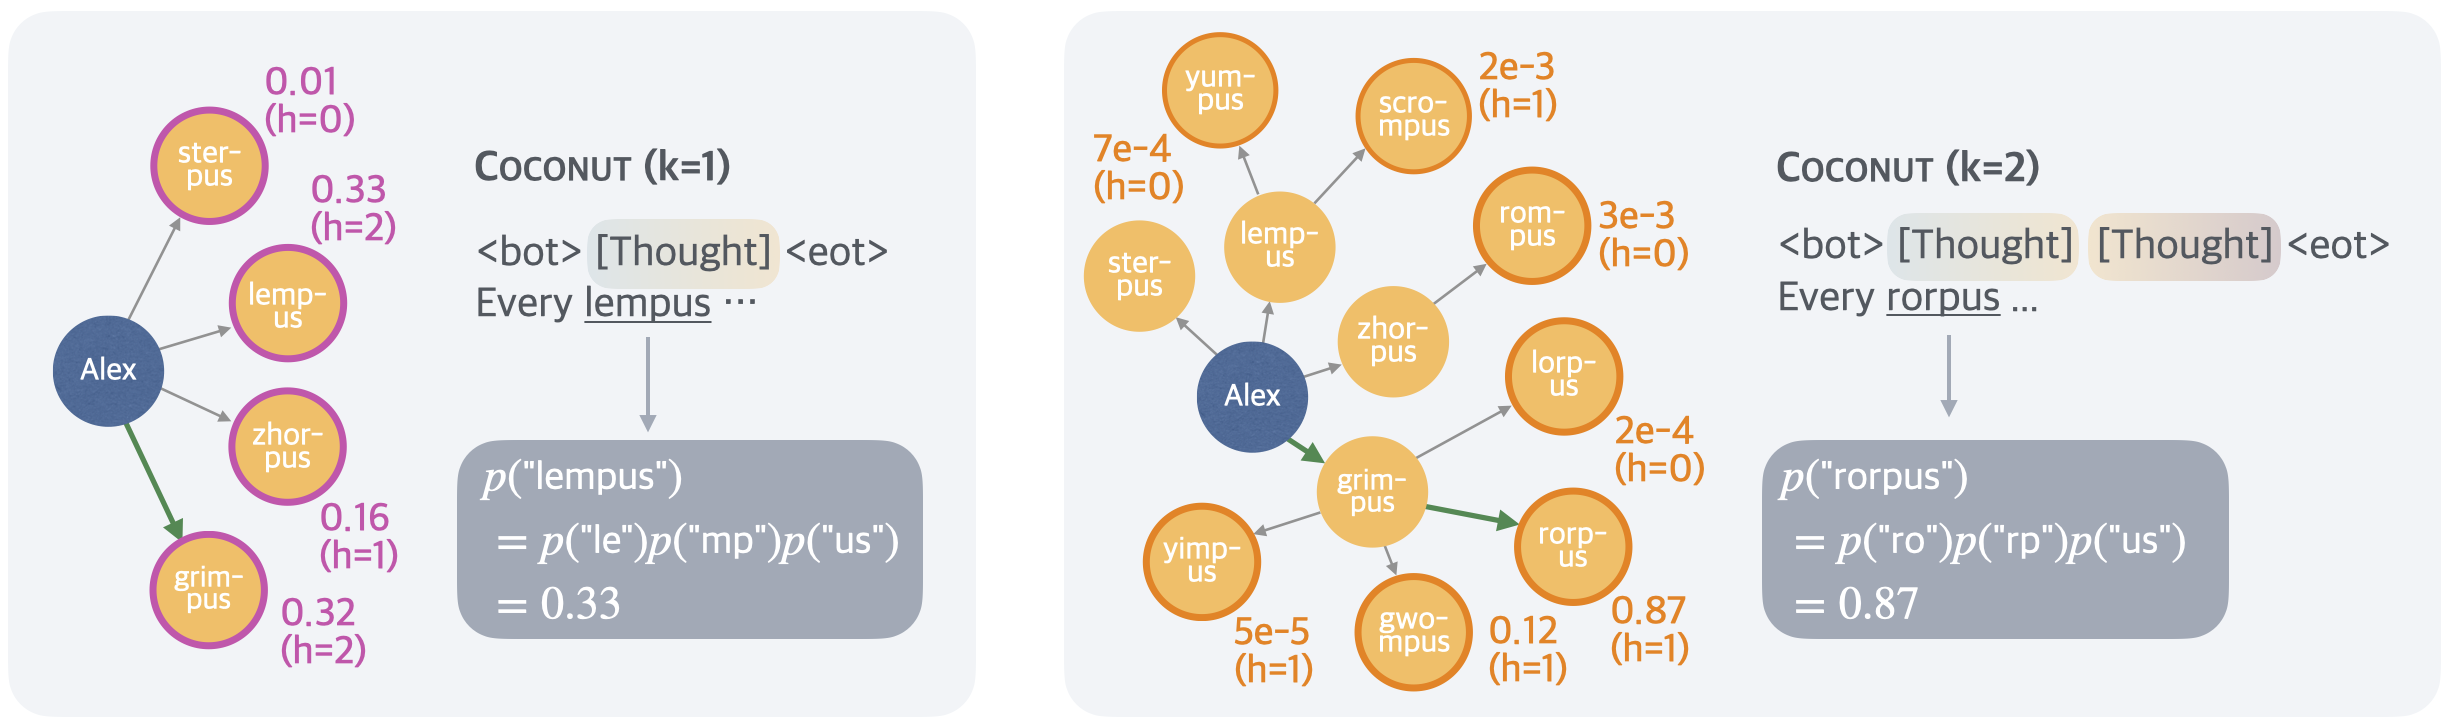
The image displays two side-by-side diagrams illustrating a probabilistic model named "COCONUT" with two different parameter settings (k=1 and k=2). Each diagram shows a central node ("Alex") connected to multiple peripheral nodes via directed arrows. The diagrams are accompanied by text snippets and mathematical equations that appear to calculate the probability of generating specific words based on component parts.
### Components/Axes
**Left Panel (COCONUT k=1):**
* **Central Node:** A blue circle labeled "Alex".
* **Peripheral Nodes:** Four purple-outlined circles with yellow fill, connected to "Alex" by gray arrows. One node ("grim-pus") is connected by a green arrow.
* Node Labels & Associated Data:
* `ster-pus`: 0.01 (h=0)
* `lemp-us`: 0.33 (h=2)
* `zhor-pus`: 0.16 (h=1)
* `grim-pus`: 0.32 (h=2)
* **Text Block (Top Right):**
* Title: `COCONUT (k=1)`
* Sequence: `<bot> [Thought] <eot>`
* Sentence Fragment: `Every lempus ...`
* **Equation Block (Bottom Right):**
* `p("lempus")`
* `= p("le")p("mp")p("us")`
* `= 0.33`
**Right Panel (COCONUT k=2):**
* **Central Node:** A blue circle labeled "Alex".
* **Peripheral Nodes:** Multiple orange-outlined circles with yellow fill, connected to "Alex" or to each other by gray arrows. One node ("rorp-us") is connected by a green arrow.
* Node Labels & Associated Data:
* `yum-pus`: 7e-4 (h=0)
* `ster-pus`: (no value shown)
* `lemp-us`: (no value shown)
* `scrom-pus`: 2e-3 (h=1)
* `zhor-pus`: (no value shown)
* `rom-pus`: 3e-3 (h=0)
* `lorp-us`: 2e-4 (h=0)
* `grim-pus`: (no value shown)
* `yimp-us`: 5e-5 (h=1)
* `gwompus`: 0.12 (h=1)
* `rorp-us`: 0.87 (h=1)
* **Text Block (Top Right):**
* Title: `COCONUT (k=2)`
* Sequence: `<bot> [Thought] [Thought] <eot>`
* Sentence Fragment: `Every rorpus ...`
* **Equation Block (Bottom Right):**
* `p("rorpus")`
* `= p("ro")p("rp")p("us")`
* `= 0.87`
### Detailed Analysis
**Spatial Layout & Connections:**
* In both panels, the "Alex" node is positioned center-left. The peripheral nodes are arranged in a fan-like pattern to its right.
* **Left Panel (k=1):** "Alex" has direct connections to four nodes. The green arrow points specifically to `grim-pus`.
* **Right Panel (k=2):** "Alex" has direct connections to several nodes (`yum-pus`, `ster-pus`, `lemp-us`, `zhor-pus`, `grim-pus`). Some nodes (`scrom-pus`, `rom-pus`, `lorp-us`, `rorp-us`) are connected to other peripheral nodes (e.g., `lemp-us` connects to `scrom-pus` and `rom-pus`; `grim-pus` connects to `lorp-us` and `rorp-us`), indicating a more complex, multi-step network. The green arrow points specifically to `rorp-us`.
**Data Values & Trends:**
* **k=1 Diagram:** The highest probability value shown is 0.33 for `lemp-us` (h=2), which matches the final calculated probability in the equation. The other values are 0.32, 0.16, and 0.01.
* **k=2 Diagram:** The highest probability value shown is 0.87 for `rorp-us` (h=1), which matches the final calculated probability. Other values are orders of magnitude smaller (0.12, 3e-3, 2e-3, 7e-4, 2e-4, 5e-5). Several nodes have no displayed value.
**Textual & Mathematical Content:**
* The text snippets (`Every lempus ...`, `Every rorpus ...`) suggest the model is generating or completing a sentence.
* The equations decompose the probability of a whole word (`p("lempus")`, `p("rorpus")`) into the product of probabilities of its sub-word components (e.g., "le", "mp", "us"). The final calculated probability (0.33, 0.87) matches the value associated with the target node in the diagram.
### Key Observations
1. **Complexity Increase with k:** Moving from k=1 to k=2 significantly increases the number of nodes and connections, creating a deeper, more hierarchical network.
2. **Probability Concentration:** In both cases, the probability mass is heavily concentrated on a single node (`lemp-us` for k=1, `rorp-us` for k=2), which is also the node highlighted by the green arrow and used in the example sentence.
3. **Parameter 'h':** Each node with a value has an associated `h` parameter (h=0, 1, or 2). In the k=1 diagram, the target node (`lemp-us`) has h=2. In the k=2 diagram, the target node (`rorp-us`) has h=1.
4. **Scientific Notation:** The k=2 diagram uses scientific notation (e.g., 7e-4) for very small probabilities, indicating a wider range of values.
### Interpretation
This image visually explains a **hierarchical probabilistic model for text or word generation**, likely a type of language model or reasoning system called COCONUT.
* **What it demonstrates:** The diagrams show how the model's internal "thought" process (represented by the network of nodes) becomes more complex when allowed more steps (k=2 vs. k=1). The central "Alex" node may represent an agent or a starting context. The peripheral nodes represent potential concepts, words, or sub-word units.
* **How elements relate:** The arrows represent probabilistic dependencies or transitions. The green arrow highlights the selected or most probable path taken by the model to generate the next word in the sequence (`lempus` or `rorpus`). The equations show the mathematical foundation: the probability of generating a word is computed from the probabilities of its constituent parts, which are derived from the network state.
* **Notable Patterns:** The model exhibits a **"winner-take-all"** dynamic where one path dominates the probability distribution, especially in the more complex k=2 setting. The `h` parameter likely represents a step count or depth within the thought process for that specific node. The increase in k allows for longer chains of reasoning (more `h` steps) and a broader exploration of possibilities (more nodes), ultimately leading to a different, more confident output (higher final probability of 0.87 vs. 0.33). This suggests that allowing the model more "thinking time" (k) refines its predictions and increases confidence in the selected output.