# Technical Document Analysis: "Coconut (k=1)" and "Coconut (k=2)" Processes
## Overview
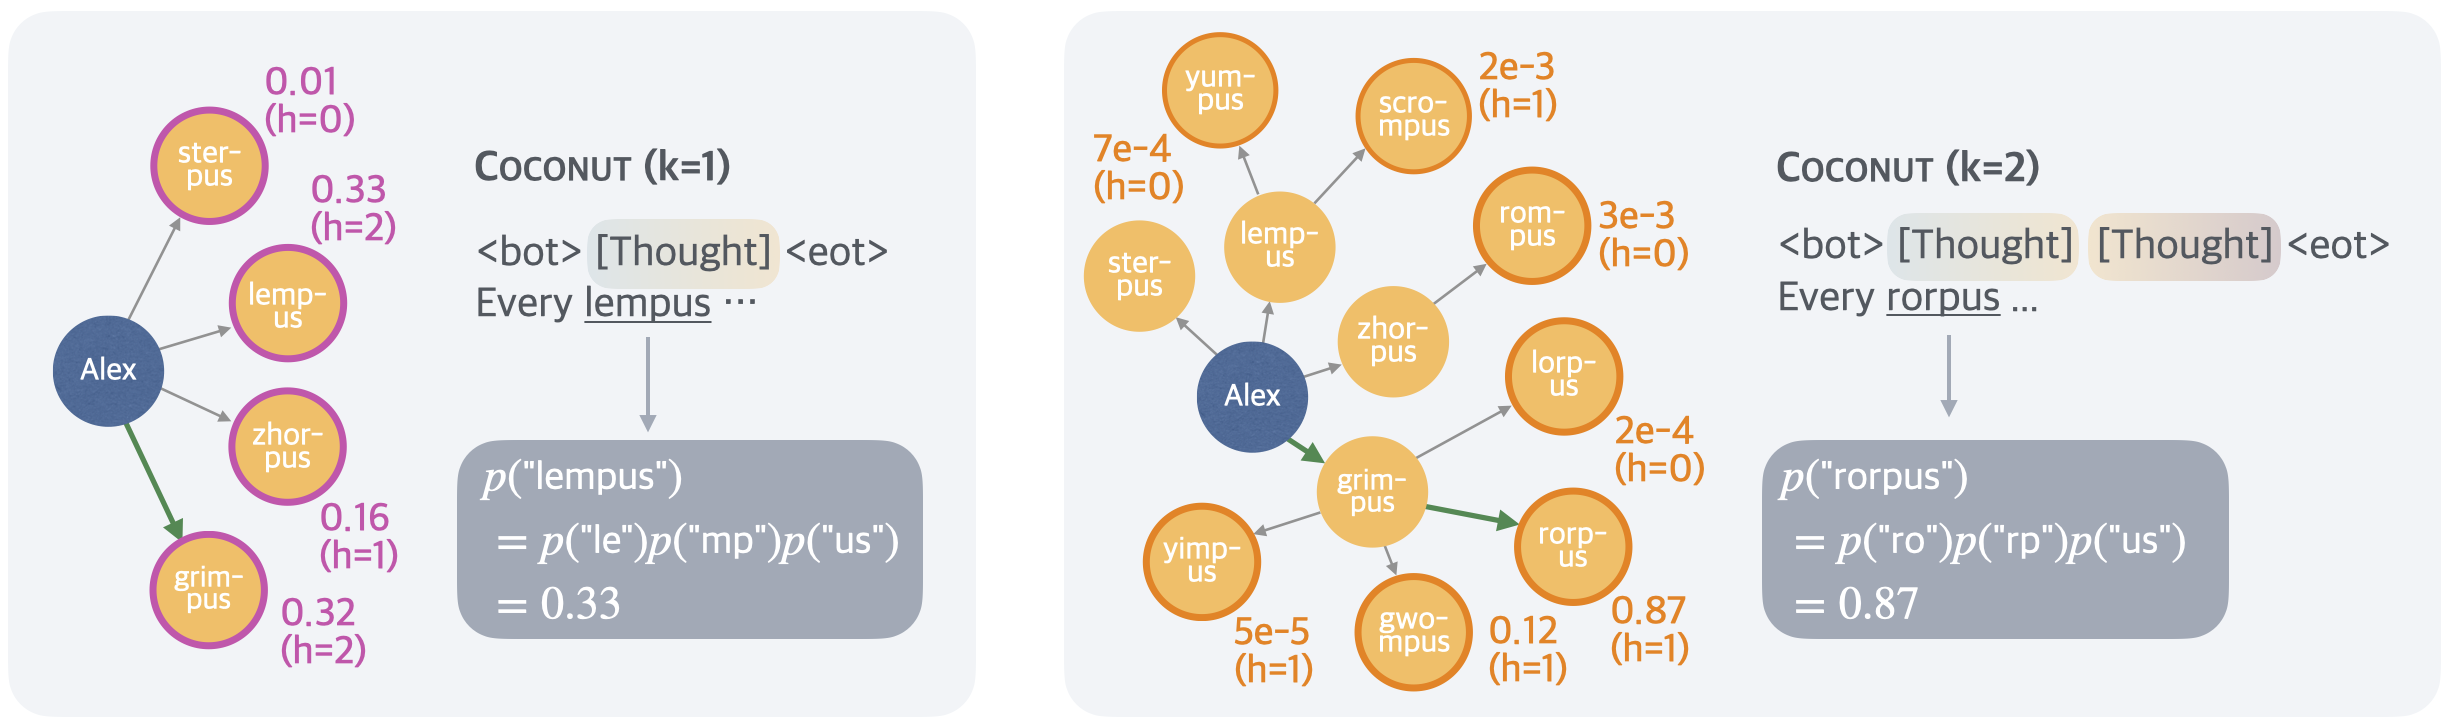
The image contains two comparative diagrams illustrating the "Coconut" process for two scenarios: **(k=1)** and **(k=2)**. Each diagram demonstrates probabilistic calculations for word decomposition, with connections between nodes and edge weights. Key elements include:
- Central node labeled **"Alex"**
- Colored nodes with labels (e.g., "sterpus," "lemplus," "rorpus")
- Edge labels showing probabilities and heights (`h=0`, `h=1`, `h=2`)
- Equations in gray boxes for calculating composite probabilities
---
## Diagram 1: **Coconut (k=1)**
### Structure
- **Central Node**: "Alex" (blue)
- **Connected Nodes**:
- **Left Side**:
- `sterpus` (purple): 0.01 (h=0)
- `lemplus` (purple): 0.33 (h=2)
- `zorpus` (purple): 0.16 (h=1)
- `grimpus` (purple): 0.32 (h=2)
- **Right Side**:
- Equation in gray box:
`p("lemplus") = p("le") * p("mp") * p("us") = 0.33`
### Key Observations
1. **Word Decomposition**:
- "lemplus" is decomposed into substrings `le`, `mp`, and `us`, with probabilities multiplied to calculate the total (`0.33`).
2. **Edge Labels**:
- Probabilities range from `0.01` (low confidence) to `0.33` (moderate confidence).
3. **Height Indicator**:
- `h=0` to `h=2` likely represents hierarchical levels or confidence thresholds.
---
## Diagram 2: **Coconut (k=2)**
### Structure
- **Central Node**: "Alex" (blue)
- **Connected Nodes**:
- **Left Side**:
- `yimpus` (orange): 5e-5 (h=1)
- `gwompus` (orange): 0.12 (h=1)
- **Center**:
- `grimpus` (orange): 0.12 (h=1)
- **Right Side**:
- `rorpus` (orange): 0.87 (h=1)
- `scrompus` (orange): 2e-3 (h=1)
- `rompus` (orange): 3e-3 (h=0)
- `yumpus` (orange): 7e-4 (h=0)
- Equation in gray box:
`p("rorpus") = p("ro") * p("rp") * p("us") = 0.87`
### Key Observations
1. **Complex Decomposition**:
- "rorpus" is decomposed into `ro`, `rp`, and `us`, yielding a high probability (`0.87`).
2. **Edge Labels**:
- Probabilities span from `5e-5` (extremely low) to `0.87` (very high).
3. **Height Indicator**:
- `h=0` and `h=1` suggest a simpler hierarchy compared to k=1.
---
## Cross-Diagram Comparison
| Component | k=1 Diagram | k=2 Diagram |
|----------------|----------------------|----------------------|
| Central Node | Alex | Alex |
| Primary Labels | sterpus, lemplus | rorpus, grimpus |
| Highest Prob | 0.33 (lemplus) | 0.87 (rorpus) |
| Edge Colors | Purple | Orange |
| Equation Format| `p("word") = ...` | `p("word") = ...` |
---
## Critical Notes
1. **Color Coding**:
- Purple in k=1 and orange in k=2 likely denote distinct word categories or confidence ranges.
2. **Mathematical Logic**:
- Probabilities are calculated as products of substring probabilities (e.g., `p("lemplus") = p("le") * p("mp") * p("us")`).
3. **Spelling Variations**:
- Words like "lemplus" and "rorpus" suggest intentional orthographic patterns for decomposition testing.
---
## Missing Information
- No explicit axis titles, legends, or spatial legend coordinates (e.g., `[x, y]` for legend) are present.
- No heatmap or chart-like visualization detected; diagrams rely on node-edge relationships and equations.
---
## Conclusion
The diagrams model a probabilistic word decomposition system ("Coconut") where composite terms are broken into substrings, and their probabilities are combined multiplicatively. The two scenarios (k=1 vs. k=2) differ in complexity and color coding but share identical calculation logic. The system prioritizes high-probability decompositions (e.g., `rorpus` at 0.87 in k=2) while accounting for edge cases (e.g., `yumpus` at 7e-4).