\n
## Line Chart: Accuracy vs. Iteration for Baseline and Curriculum Learning
### Overview
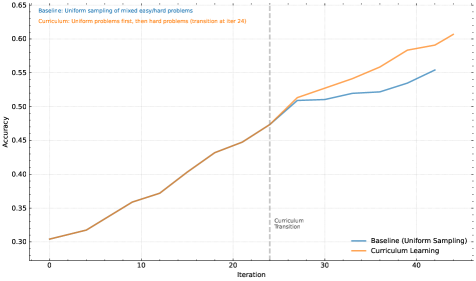
This image presents a line chart comparing the accuracy of two learning methods – Baseline (Uniform Sampling) and Curriculum Learning – over a series of iterations. The chart visually demonstrates how accuracy changes as the number of iterations increases, with a notable transition point for the Curriculum Learning method.
### Components/Axes
* **X-axis:** Iteration (ranging from approximately 0 to 45).
* **Y-axis:** Accuracy (ranging from approximately 0.30 to 0.65).
* **Data Series 1:** Baseline (Uniform Sampling) – represented by a blue line.
* **Data Series 2:** Curriculum Learning – represented by an orange line.
* **Legend:** Located in the bottom-right corner, clearly labeling each data series with its corresponding color.
* **Title/Annotation:** Located at the top-left corner, describing the two methods: "Baseline: Uniform sampling of mixed easy/hard problems." and "Curriculum: Uniform problems first, then hard problems (transition at bar 24)".
* **Vertical dashed line:** Located at approximately iteration 24, labeled "Curriculum Transition".
### Detailed Analysis
**Baseline (Uniform Sampling) - Blue Line:**
The blue line starts at approximately 0.31 at iteration 0. It exhibits a relatively slow and steady upward slope until approximately iteration 30, where the slope increases slightly. At iteration 45, the accuracy reaches approximately 0.55.
**Curriculum Learning - Orange Line:**
The orange line begins at approximately 0.30 at iteration 0. It shows a consistent upward trend, steeper than the baseline, until approximately iteration 24. At iteration 24, coinciding with the "Curriculum Transition" marker, the slope increases significantly. At iteration 45, the accuracy reaches approximately 0.61.
**Data Points (Approximate):**
| Iteration | Baseline Accuracy | Curriculum Learning Accuracy |
|---|---|---|
| 0 | 0.31 | 0.30 |
| 5 | 0.33 | 0.37 |
| 10 | 0.36 | 0.42 |
| 15 | 0.40 | 0.46 |
| 20 | 0.43 | 0.49 |
| 24 | 0.45 | 0.52 |
| 30 | 0.49 | 0.56 |
| 35 | 0.52 | 0.59 |
| 40 | 0.54 | 0.60 |
| 45 | 0.55 | 0.61 |
### Key Observations
* Curriculum Learning consistently outperforms Baseline (Uniform Sampling) throughout the iterations.
* The "Curriculum Transition" at iteration 24 marks a significant acceleration in the accuracy improvement for Curriculum Learning.
* The Baseline accuracy increases more slowly and remains lower than Curriculum Learning.
* Both methods show a general trend of increasing accuracy with more iterations.
### Interpretation
The data suggests that Curriculum Learning is a more effective approach than Uniform Sampling for this particular task. The initial phase of Curriculum Learning, focusing on easier problems, likely allows the model to establish a strong foundation before tackling more complex challenges. The transition to harder problems at iteration 24 appears to be a critical point, triggering a substantial increase in learning rate. The Baseline method, by randomly sampling both easy and hard problems, may struggle to achieve the same level of performance due to the constant mixing of difficulty levels. The consistent upward trend for both methods indicates that continued iteration generally leads to improved accuracy, but the magnitude of improvement is significantly higher with Curriculum Learning. The vertical dashed line at iteration 24 is a key indicator of the effectiveness of the curriculum approach, showing a clear inflection point in the learning curve.