## Diagram: LLM-Based Inference Prompt Construction
### Overview
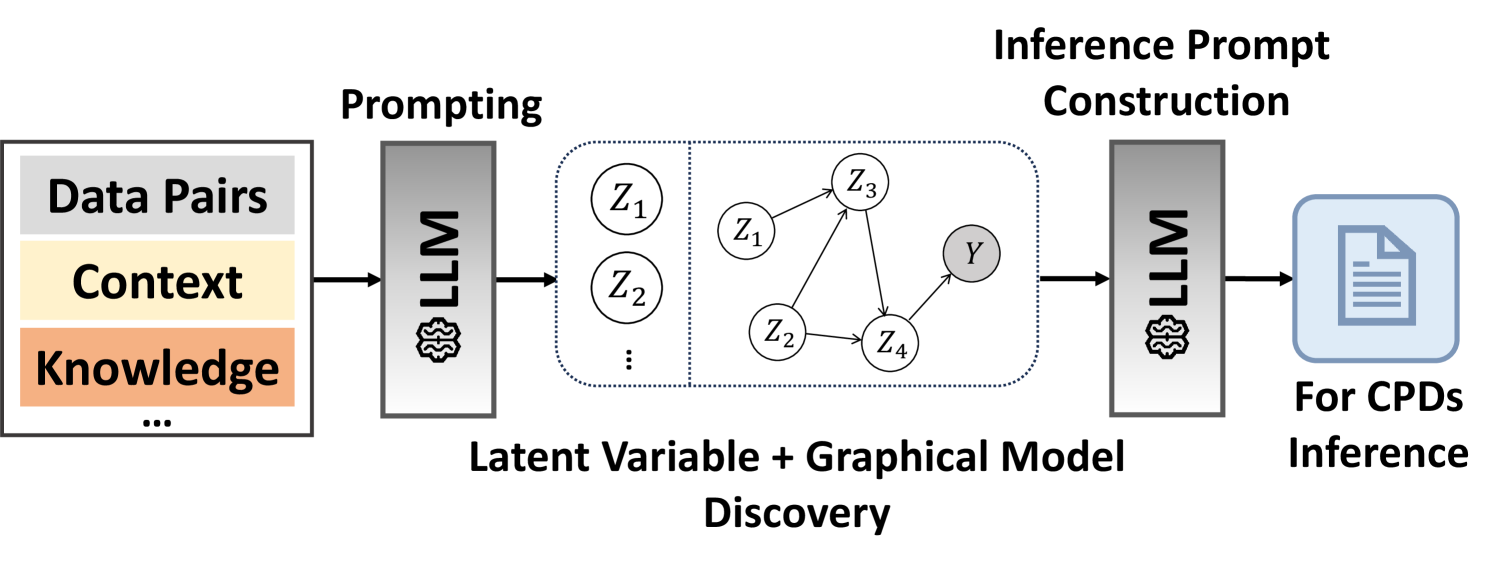
The image is a diagram illustrating a process for inference prompt construction using a Large Language Model (LLM). The process starts with data, context, and knowledge, which are fed into an LLM for prompting. The LLM then facilitates latent variable and graphical model discovery. Finally, another LLM is used for inference prompt construction, leading to CPDs (Conditional Probability Distributions) inference.
### Components/Axes
* **Data Pairs:** A block representing input data.
* **Context:** A block representing contextual information.
* **Knowledge:** A block representing prior knowledge.
* **...**: Indicates that there may be more inputs.
* **Prompting:** The title of the first stage.
* **LLM:** Represents a Large Language Model, depicted as a gray rectangle with a brain icon.
* **Latent Variable + Graphical Model Discovery:** The title of the second stage, which involves discovering latent variables and constructing a graphical model.
* **Z1, Z2, Z3, Z4:** Latent variables represented as circles.
* **Y:** A target variable, represented as a gray circle.
* **Arrows:** Indicate the relationships between the latent variables and the target variable in the graphical model.
* **Inference Prompt Construction:** The title of the third stage.
* **For CPDs Inference:** Represents the output of the process, depicted as a document icon.
### Detailed Analysis
1. **Input Stage:**
* The input consists of "Data Pairs" (top, gray), "Context" (middle, yellow), and "Knowledge" (bottom, orange).
* An ellipsis "..." indicates additional unspecified inputs.
2. **Prompting Stage:**
* The inputs are fed into an "LLM" block.
* The "LLM" block is gray and has a brain icon on the bottom-left.
* The title of this stage is "Prompting".
3. **Latent Variable + Graphical Model Discovery Stage:**
* This stage involves discovering latent variables and constructing a graphical model.
* The latent variables are represented as circles labeled "Z1", "Z2", "Z3", and "Z4".
* The target variable is represented as a gray circle labeled "Y".
* Arrows indicate the relationships between the variables.
* The title of this stage is "Latent Variable + Graphical Model Discovery".
4. **Inference Prompt Construction Stage:**
* The output of the previous stage is fed into another "LLM" block.
* The title of this stage is "Inference Prompt Construction".
5. **Output Stage:**
* The output of the process is "For CPDs Inference", represented as a document icon.
### Key Observations
* The diagram illustrates a multi-stage process that leverages LLMs for inference prompt construction.
* The process involves data input, latent variable discovery, graphical model construction, and inference.
* Two LLMs are used in the process: one for prompting and another for inference prompt construction.
### Interpretation
The diagram presents a framework for using LLMs to automate the process of constructing inference prompts. By leveraging data, context, and knowledge, the LLM can discover latent variables and construct a graphical model, which can then be used to generate inference prompts for CPDs. This approach has the potential to improve the efficiency and accuracy of inference tasks by automating the prompt engineering process. The use of latent variable discovery suggests that the model is designed to handle complex, high-dimensional data where the underlying relationships between variables are not immediately apparent.