## Diagram: LLM-Based Latent Variable and Graphical Model Discovery Pipeline
### Overview
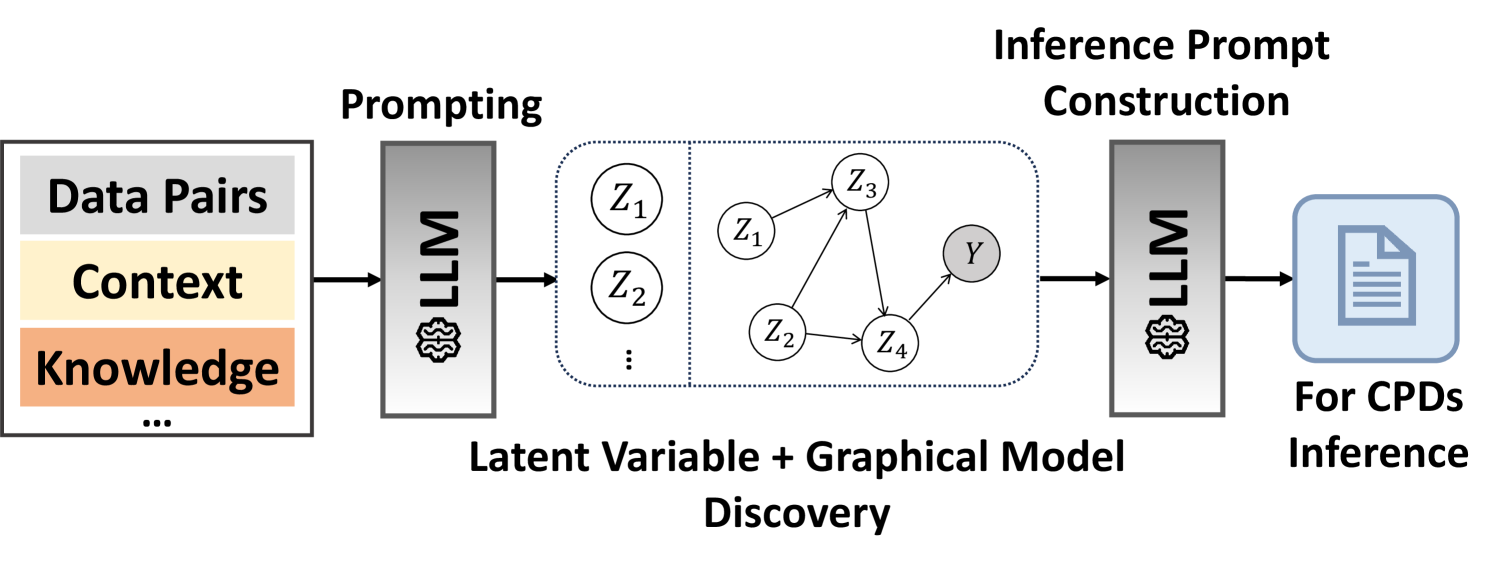
The image is a technical flowchart illustrating a two-stage process that uses a Large Language Model (LLM) to first discover latent variables and a graphical model from input data, and then to construct an inference prompt for performing inference on Conditional Probability Distributions (CPDs). The flow proceeds from left to right.
### Components/Axes
The diagram is composed of several distinct blocks connected by directional arrows, indicating data or process flow.
**1. Input Block (Leftmost):**
* **Position:** Far left.
* **Content:** A rectangular box containing three labeled, stacked horizontal bars.
* Top bar (Gray): **"Data Pairs"**
* Middle bar (Light Yellow): **"Context"**
* Bottom bar (Light Orange): **"Knowledge"**
* Below the bars: An ellipsis **"..."** indicating additional, unspecified input types.
* **Function:** Represents the combined input fed into the first LLM stage.
**2. First Processing Stage:**
* **Label (Above):** **"Prompting"**
* **Component:** A vertical gray rectangle labeled **"LLM"** with a stylized brain/chip icon at the bottom.
* **Input:** An arrow from the Input Block.
* **Output:** An arrow pointing to the central discovery block.
**3. Central Discovery Block:**
* **Label (Below):** **"Latent Variable + Graphical Model Discovery"**
* **Content:** A large, dotted-outline rectangle divided into two sections by a vertical dotted line.
* **Left Section:** Contains circles labeled **"Z₁"**, **"Z₂"**, and a vertical ellipsis **"⋮"**, representing a set of discovered latent variables.
* **Right Section:** Contains a directed acyclic graph (DAG) with nodes and arrows.
* **Nodes:** Circles labeled **"Z₁"**, **"Z₂"**, **"Z₃"**, **"Z₄"**, and a shaded circle labeled **"Y"**.
* **Edges (Arrows):** Show dependencies: Z₁ → Z₃, Z₂ → Z₃, Z₂ → Z₄, Z₃ → Y, Z₄ → Y.
* **Function:** Visualizes the output of the first LLM stage: a set of latent variables (Z₁, Z₂...) and a learned graphical model structure showing probabilistic relationships between latent variables (Z) and an observed variable (Y).
**4. Second Processing Stage:**
* **Label (Above):** **"Inference Prompt Construction"**
* **Component:** A second vertical gray rectangle identical to the first, labeled **"LLM"** with the same icon.
* **Input:** An arrow from the Central Discovery Block.
* **Output:** An arrow pointing to the final output block.
**5. Output Block (Rightmost):**
* **Position:** Far right.
* **Content:** A light blue rounded rectangle containing a document icon.
* **Label (Below):** **"For CPDs Inference"**
* **Function:** Represents the final output: a constructed prompt ready to be used for inferring Conditional Probability Distributions (CPDs) based on the discovered model.
### Detailed Analysis
The diagram outlines a clear, sequential pipeline:
1. **Input Aggregation:** Multiple forms of information (Data Pairs, Context, Knowledge) are combined.
2. **First LLM Interaction (Prompting):** The aggregated input is used to prompt an LLM.
3. **Model Discovery:** The LLM's output is not a direct answer but a structured discovery: a set of latent variables (`Z₁`, `Z₂`, etc.) and a probabilistic graphical model (a DAG) defining how these latent variables and an observed variable `Y` relate to each other.
4. **Prompt Construction:** The discovered model structure is then fed into a second LLM interaction, specifically to construct a prompt.
5. **Final Inference Task:** The constructed prompt is designed for the specific task of performing inference on Conditional Probability Distributions (CPDs), which are fundamental components of the discovered graphical model.
### Key Observations
* **Two-Stage LLM Use:** The architecture explicitly uses the LLM twice for distinct purposes: first for *discovery* (unsupervised/structured output), and second for *prompt engineering* (task-specific application).
* **Latent Variable Focus:** The core of the discovery is identifying unobserved variables (`Z`) that explain the data, a common technique in causal and probabilistic modeling.
* **Graphical Model as Intermediate Representation:** The discovered DAG serves as a crucial, interpretable intermediate representation between raw data and the final inference task.
* **Task Specificity:** The pipeline is not generic; it is specifically geared towards probabilistic inference (CPDs), suggesting an application in causal discovery, Bayesian networks, or similar fields.
### Interpretation
This diagram represents a sophisticated methodology for **automating the construction of probabilistic models** using LLMs. The process suggests that instead of manually defining a model's structure and variables, an LLM can be prompted to *discover* them from raw data and context. The second stage then translates this discovered structure into an effective prompt for performing downstream inference.
The pipeline implies a **Peircean abductive reasoning** process: the first LLM stage takes observed data and context (the *sign*) and abduces the most plausible underlying structure (the *latent variables and their relations*—the *object*). The second stage then uses this hypothesized structure to make specific inferences (the *interpretant*).
The key innovation is using the LLM not just as a text generator, but as a **reasoning engine for model discovery and meta-prompting**. This could significantly lower the barrier for applying complex probabilistic models, as the LLM handles the technical steps of variable identification and structure learning. The "Knowledge" input bar is particularly notable, suggesting the model can incorporate prior domain knowledge to guide the discovery process, making it a form of **knowledge-enhanced machine learning**. The final output for "CPDs Inference" indicates the ultimate goal is quantitative, probabilistic reasoning about the relationships within the discovered model.