# Technical Document Extraction: Image Analysis
## Overview
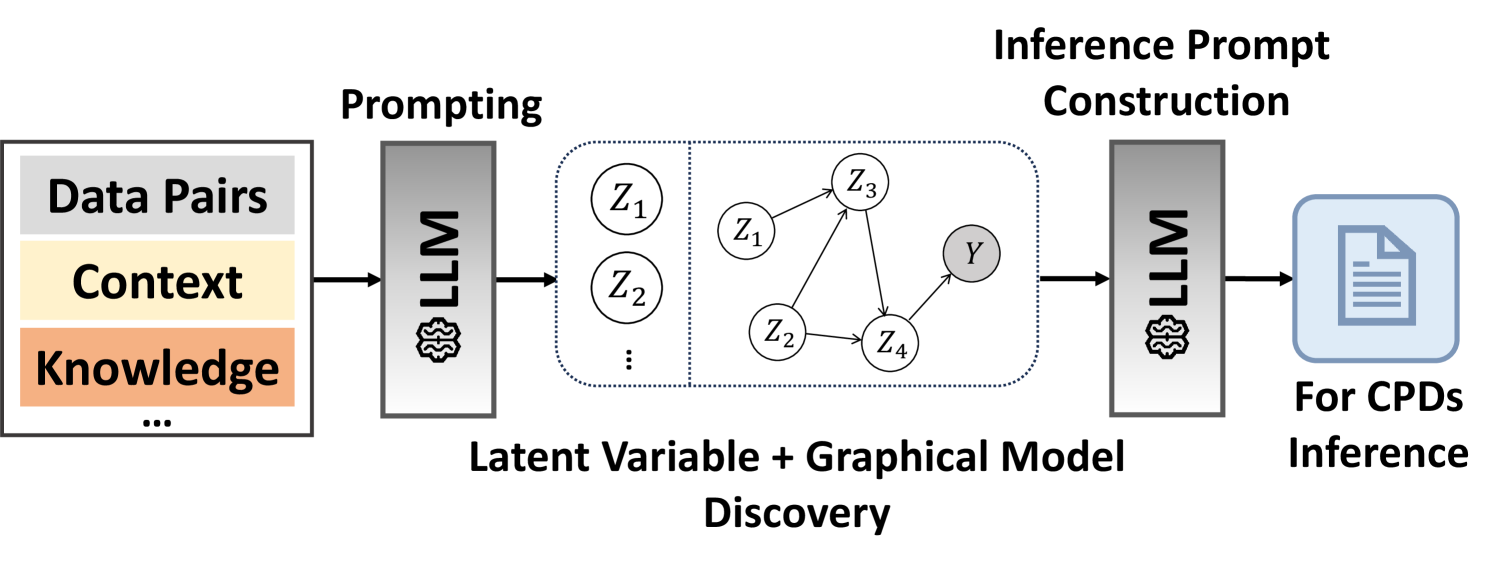
The image depicts a **flowchart** illustrating a multi-stage process involving **Large Language Models (LLMs)**, **latent variable discovery**, and **inference prompt construction** for **Causal Probabilistic Dependencies (CPDs) inference**. Below is a detailed breakdown of components, labels, and flow.
---
## Key Components and Labels
### 1. **Prompting Stage**
- **Input Box**:
- **Labels**:
- `Data Pairs` (gray)
- `Context` (yellow)
- `Knowledge` (orange)
- **Purpose**: Represents the foundational inputs for the LLM.
- **LLM Block**:
- **Label**: `LLM` (gray box with brain icon)
- **Function**: Processes input data pairs, context, and knowledge to generate latent variables.
### 2. **Latent Variable + Graphical Model Discovery**
- **Latent Variables**:
- **Labels**:
- `Z₁`, `Z₂`, `Z₃`, `Z₄` (circles with subscripts)
- **Graphical Model**:
- **Structure**:
- `Z₁` → `Z₃` → `Y`
- `Z₂` → `Z₄` → `Y`
- **Purpose**: Represents discovered relationships between latent variables and the target variable `Y`.
### 3. **Inference Prompt Construction**
- **LLM Block**:
- **Label**: `LLM` (gray box with brain icon)
- **Function**: Uses the graphical model to construct an inference prompt.
- **Output**:
- **Label**: `For CPDs Inference` (blue document icon)
- **Purpose**: Final output for causal probabilistic dependency analysis.
---
## Flow and Connections
1. **Data Flow**:
- `Data Pairs` + `Context` + `Knowledge` → `LLM` (Prompting)
- `LLM` → Latent Variables (`Z₁`, `Z₂`, `Z₃`, `Z₄`) + Graphical Model
- Graphical Model → `LLM` (Inference Prompt Construction)
- `LLM` → `For CPDs Inference` (Final Output)
2. **Visual Arrows**:
- Solid arrows indicate direct data flow.
- Dotted arrows (e.g., between `Z₁`, `Z₂`, `Z₃`, `Z₄`, `Y`) represent inferred relationships in the graphical model.
---
## Spatial Grounding and Color Analysis
- **Color Coding**:
- `Data Pairs`: Gray
- `Context`: Yellow
- `Knowledge`: Orange
- `LLM`: Gray (with brain icon)
- `CPDs Inference`: Blue (document icon)
- **Legend**: No explicit legend is present in the image. Color assignments are inferred from block labels.
---
## Trend Verification
- **No numerical data or trends** are present in the image. The flowchart focuses on **process flow** rather than quantitative analysis.
---
## Component Isolation
### Header
- **Title**: Not explicitly labeled, but the flowchart is titled **"Prompting"**, **"Latent Variable + Graphical Model Discovery"**, and **"Inference Prompt Construction"**.
### Main Chart
- **Sections**:
1. **Prompting**: Input data pairs, context, and knowledge fed into the LLM.
2. **Latent Variable + Graphical Model Discovery**: LLM generates latent variables and their relationships.
3. **Inference Prompt Construction**: LLM uses the graphical model to create a prompt for CPDs inference.
### Footer
- **Output**: Final document labeled `For CPDs Inference`.
---
## Conclusion
The image outlines a structured workflow for leveraging LLMs to discover latent variables, construct graphical models, and generate inference prompts for causal analysis. No numerical data or trends are present; the focus is on **process design** and **component interactions**.