## Bar Chart: Latency Comparison Across Datasets and Methods
### Overview
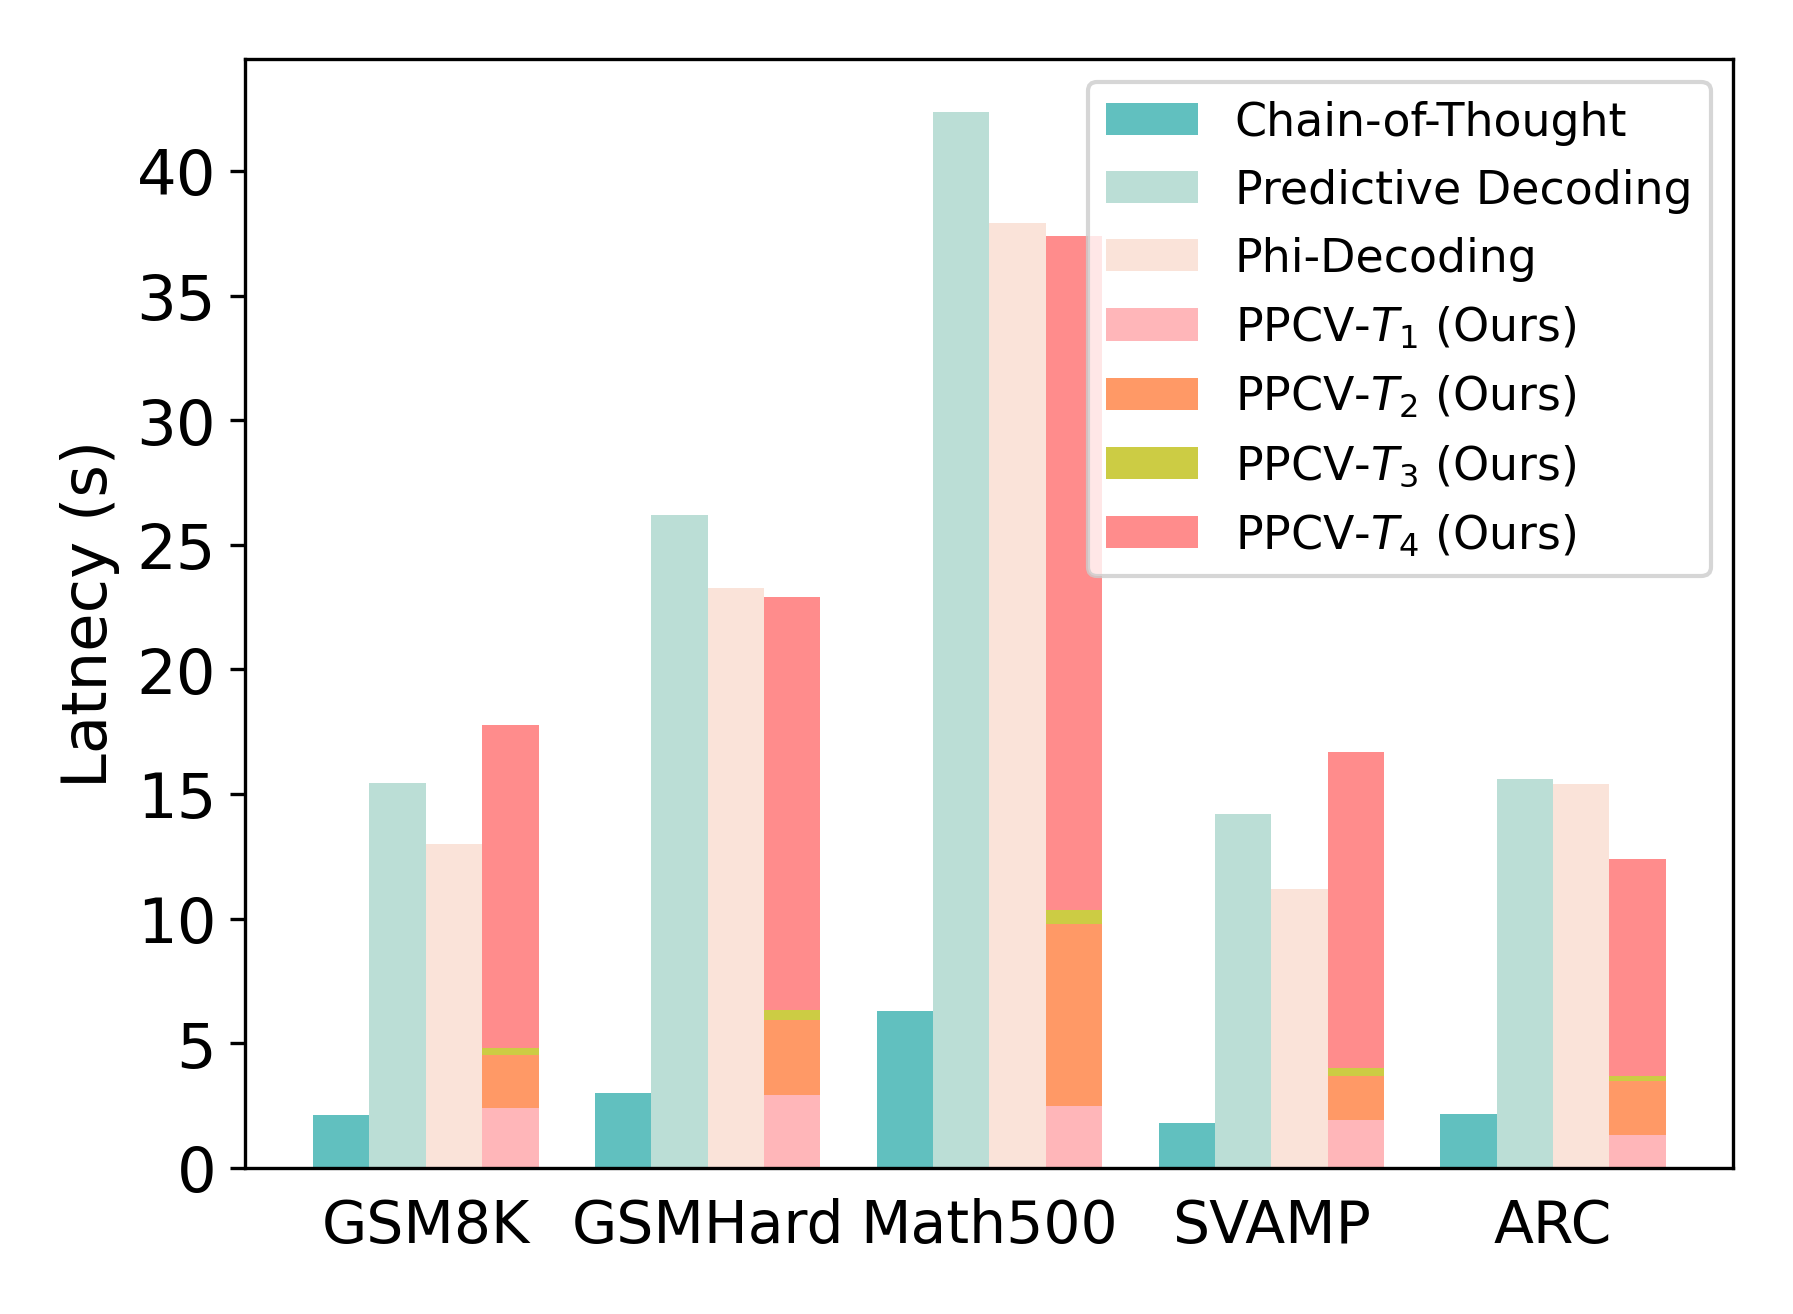
The chart compares latency (in seconds) across five datasets (GSM8K, GSMHard, Math500, SVAMP, ARC) for six different methods: Chain-of-Thought, Predictive Decoding, Phi-Decoding, and four variants of PPCV (PPCV-T1 to T4). Latency values are represented as stacked bar segments, with each method assigned a distinct color.
### Components/Axes
- **X-axis (Datasets)**: GSM8K, GSMHard, Math500, SVAMP, ARC (categorical, left to right).
- **Y-axis (Latency)**: 0–40 seconds (linear scale, increments of 5).
- **Legend**: Located in the top-right corner, mapping colors to methods:
- **Chain-of-Thought**: Teal (#008080)
- **Predictive Decoding**: Light blue (#ADD8E6)
- **Phi-Decoding**: Light pink (#FFD1DC)
- **PPCV-T1 (Ours)**: Dark pink (#FF69B4)
- **PPCV-T2 (Ours)**: Orange (#FFA500)
- **PPCV-T3 (Ours)**: Yellow (#FFFF00)
- **PPCV-T4 (Ours)**: Red (#FF0000)
### Detailed Analysis
1. **GSM8K**:
- **Chain-of-Thought**: ~2s (teal, shortest segment).
- **Predictive Decoding**: ~15s (light blue, second tallest).
- **Phi-Decoding**: ~13s (light pink, third tallest).
- **PPCV-T1**: ~18s (dark pink, tallest).
- **PPCV-T2**: ~5s (orange, second shortest).
- **PPCV-T3**: ~1s (yellow, shortest).
- **PPCV-T4**: ~3s (red, second shortest).
2. **GSMHard**:
- **Chain-of-Thought**: ~3s (teal).
- **Predictive Decoding**: ~26s (light blue, tallest).
- **Phi-Decoding**: ~23s (light pink, second tallest).
- **PPCV-T1**: ~24s (dark pink, third tallest).
- **PPCV-T2**: ~6s (orange, fourth tallest).
- **PPCV-T3**: ~1s (yellow, shortest).
- **PPCV-T4**: ~4s (red, second shortest).
3. **Math500**:
- **Chain-of-Thought**: ~6s (teal).
- **Predictive Decoding**: ~42s (light blue, tallest).
- **Phi-Decoding**: ~38s (light pink, second tallest).
- **PPCV-T1**: ~37s (dark pink, third tallest).
- **PPCV-T2**: ~10s (orange, fourth tallest).
- **PPCV-T3**: ~1s (yellow, shortest).
- **PPCV-T4**: ~12s (red, fifth tallest).
4. **SVAMP**:
- **Chain-of-Thought**: ~2s (teal).
- **Predictive Decoding**: ~14s (light blue, tallest).
- **Phi-Decoding**: ~11s (light pink, second tallest).
- **PPCV-T1**: ~17s (dark pink, third tallest).
- **PPCV-T2**: ~4s (orange, fourth tallest).
- **PPCV-T3**: ~1s (yellow, shortest).
- **PPCV-T4**: ~6s (red, fifth tallest).
5. **ARC**:
- **Chain-of-Thought**: ~2.5s (teal).
- **Predictive Decoding**: ~15.5s (light blue, tallest).
- **Phi-Decoding**: ~15s (light pink, second tallest).
- **PPCV-T1**: ~12.5s (dark pink, third tallest).
- **PPCV-T2**: ~3.5s (orange, fourth tallest).
- **PPCV-T3**: ~1.5s (yellow, shortest).
- **PPCV-T4**: ~4.5s (red, fifth tallest).
### Key Observations
- **Predictive Decoding** consistently shows the highest latency across all datasets, peaking at ~42s for Math500.
- **Chain-of-Thought** has the lowest latency (~1.5–6s) but is often the shortest segment.
- **Phi-Decoding** and **PPCV-T1** exhibit moderate-to-high latency, with PPCV-T1 being the tallest in GSM8K and SVAMP.
- **PPCV-T3** (yellow) is the shortest segment in all datasets, indicating the fastest performance.
- **Math500** has the highest overall latency values, while **GSM8K** and **ARC** show the lowest.
### Interpretation
The data suggests that **PPCV-T3** (yellow) is the most efficient method across all datasets, with latencies consistently below 2s. **Predictive Decoding** (light blue) performs poorly in terms of latency, particularly on Math500, which may reflect the dataset's complexity. **Phi-Decoding** and **PPCV-T1** show intermediate performance, with PPCV-T1 being the most variable. The **Chain-of-Thought** method, while fast, may lack accuracy or robustness compared to other methods. The segmentation of bars highlights trade-offs between speed and performance, with no single method dominating all datasets.