## Bar Chart: Latency Comparison of Different Decoding Methods
### Overview
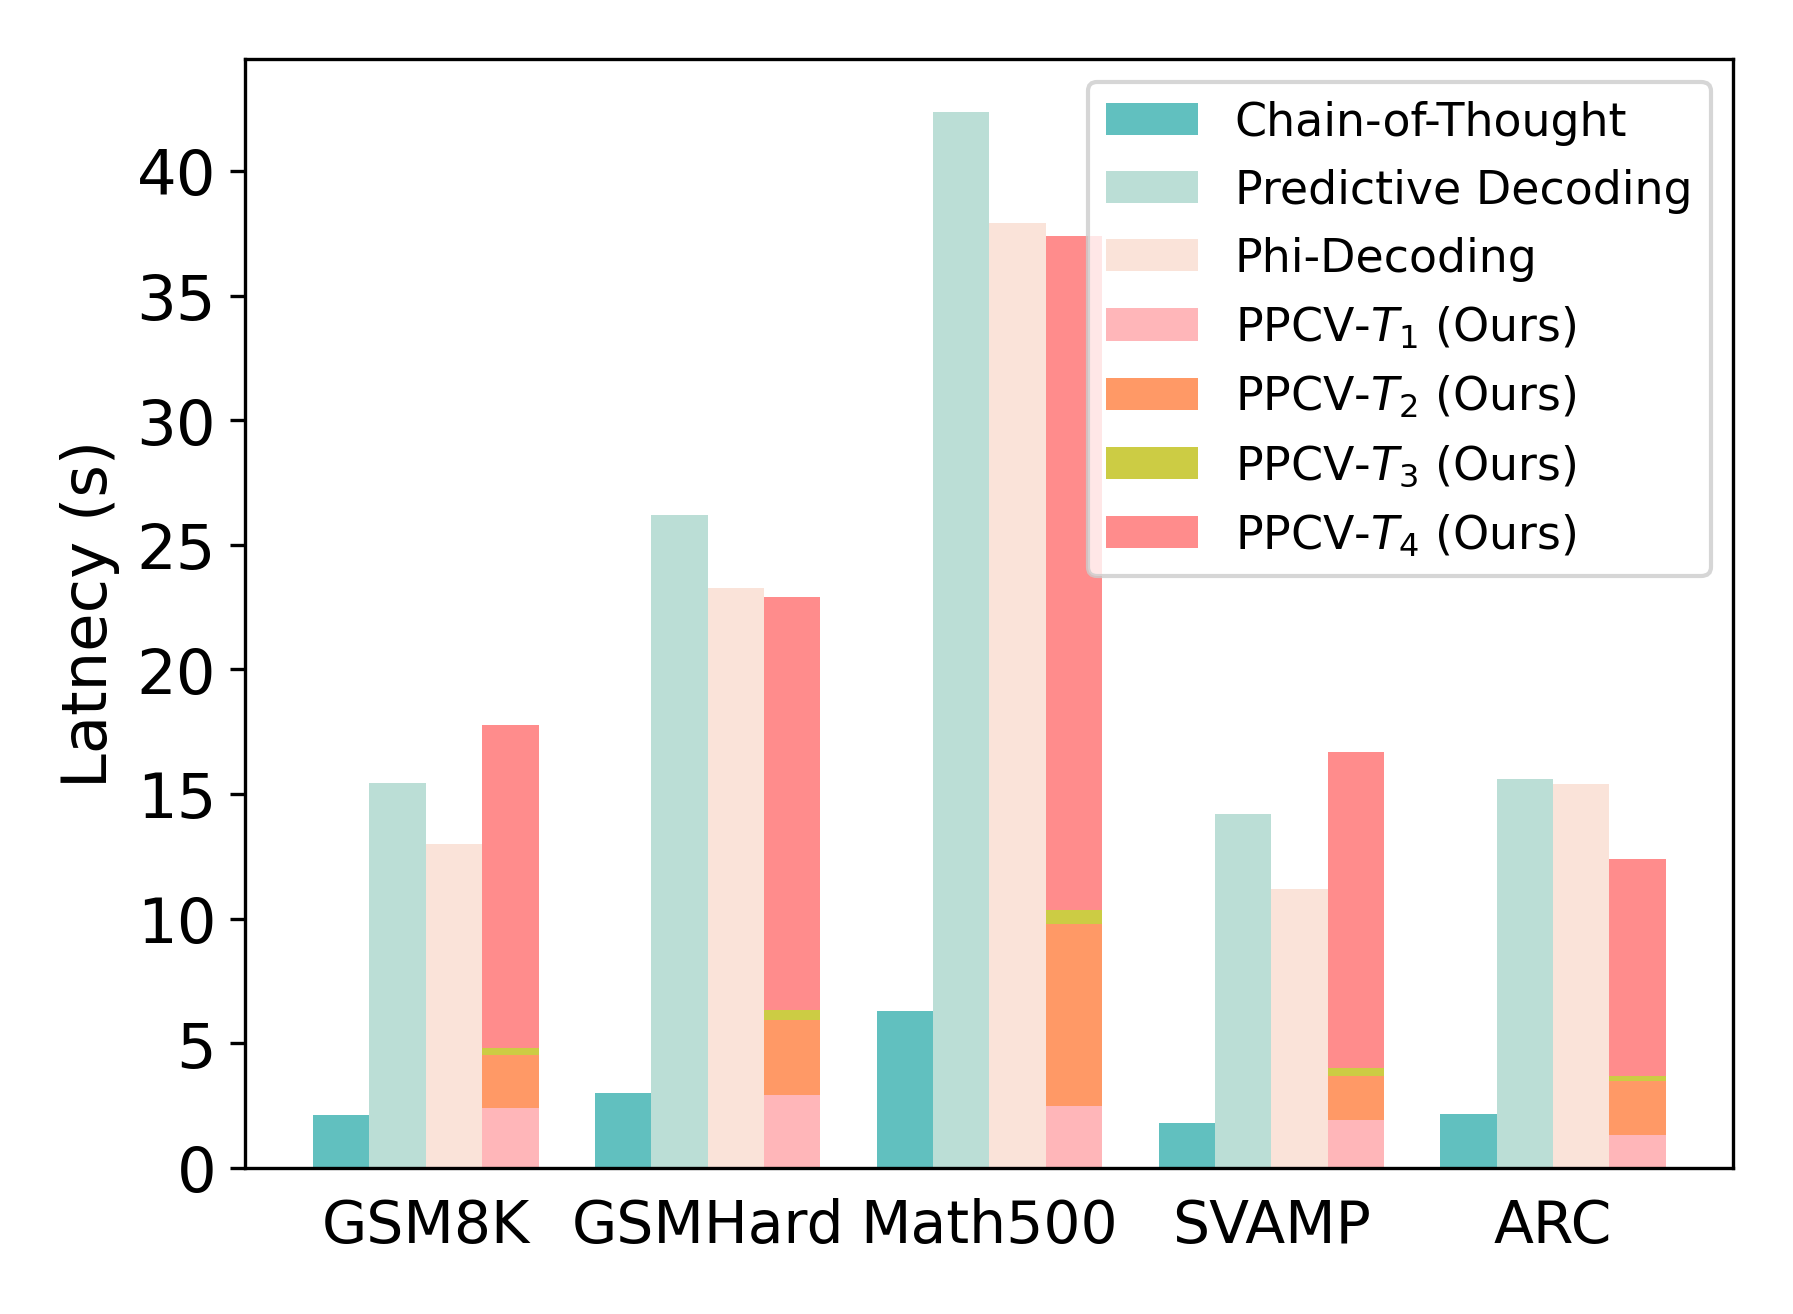
The image is a bar chart comparing the latency (in seconds) of different decoding methods across five datasets: GSM8K, GSMHard, Math500, SVAMP, and ARC. The chart displays the latency for Chain-of-Thought, Predictive Decoding, Phi-Decoding, and four variations of PPCV (T1, T2, T3, and T4).
### Components/Axes
* **Y-axis:** Latency (s), with a scale from 0 to 40 in increments of 5.
* **X-axis:** Datasets: GSM8K, GSMHard, Math500, SVAMP, ARC.
* **Legend (Top-Right):**
* Chain-of-Thought (Teal)
* Predictive Decoding (Light Blue)
* Phi-Decoding (Pale Pink)
* PPCV-T1 (Ours) (Light Pink)
* PPCV-T2 (Ours) (Orange)
* PPCV-T3 (Ours) (Yellow-Green)
* PPCV-T4 (Ours) (Salmon Pink)
### Detailed Analysis
**GSM8K Dataset:**
* Chain-of-Thought: ~2.2 s
* Predictive Decoding: ~15.5 s
* Phi-Decoding: ~13 s
* PPCV-T1: ~2.5 s
* PPCV-T2: ~4 s
* PPCV-T3: ~5 s
* PPCV-T4: ~18 s
**GSMHard Dataset:**
* Chain-of-Thought: ~3 s
* Predictive Decoding: ~26.5 s
* Phi-Decoding: ~23 s
* PPCV-T1: ~3 s
* PPCV-T2: ~6.5 s
* PPCV-T3: ~7 s
* PPCV-T4: ~23 s
**Math500 Dataset:**
* Chain-of-Thought: ~6.5 s
* Predictive Decoding: ~42 s
* Phi-Decoding: ~37.5 s
* PPCV-T1: ~2.5 s
* PPCV-T2: ~28 s
* PPCV-T3: ~10 s
* PPCV-T4: ~38 s
**SVAMP Dataset:**
* Chain-of-Thought: ~2 s
* Predictive Decoding: ~14 s
* Phi-Decoding: ~11 s
* PPCV-T1: ~2 s
* PPCV-T2: ~2 s
* PPCV-T3: ~3 s
* PPCV-T4: ~17 s
**ARC Dataset:**
* Chain-of-Thought: ~2.2 s
* Predictive Decoding: ~15.5 s
* Phi-Decoding: ~15 s
* PPCV-T1: ~2 s
* PPCV-T2: ~3 s
* PPCV-T3: ~3.5 s
* PPCV-T4: ~12.5 s
### Key Observations
* Predictive Decoding consistently exhibits the highest latency across all datasets.
* Chain-of-Thought generally has the lowest latency.
* PPCV-T1, T2, and T3 show relatively low latency compared to other methods.
* PPCV-T4 latency varies across datasets, sometimes being comparable to Phi-Decoding.
* Math500 shows the largest latency differences between Predictive Decoding and Chain-of-Thought.
### Interpretation
The bar chart illustrates the performance of different decoding methods in terms of latency across various datasets. Predictive Decoding and Phi-Decoding generally have higher latencies, suggesting they are more computationally intensive. Chain-of-Thought demonstrates the lowest latency, indicating it is the most efficient in terms of processing time. The PPCV variations show varying performance, with T1, T2, and T3 consistently exhibiting low latency, while T4's performance is more dataset-dependent. The Math500 dataset appears to be the most challenging, as it shows the largest latency values for Predictive Decoding and Phi-Decoding. The data suggests that the choice of decoding method significantly impacts latency, and the optimal method may vary depending on the specific dataset.