## Grouped Bar Chart: Latency Comparison of Decoding Methods Across Datasets
### Overview
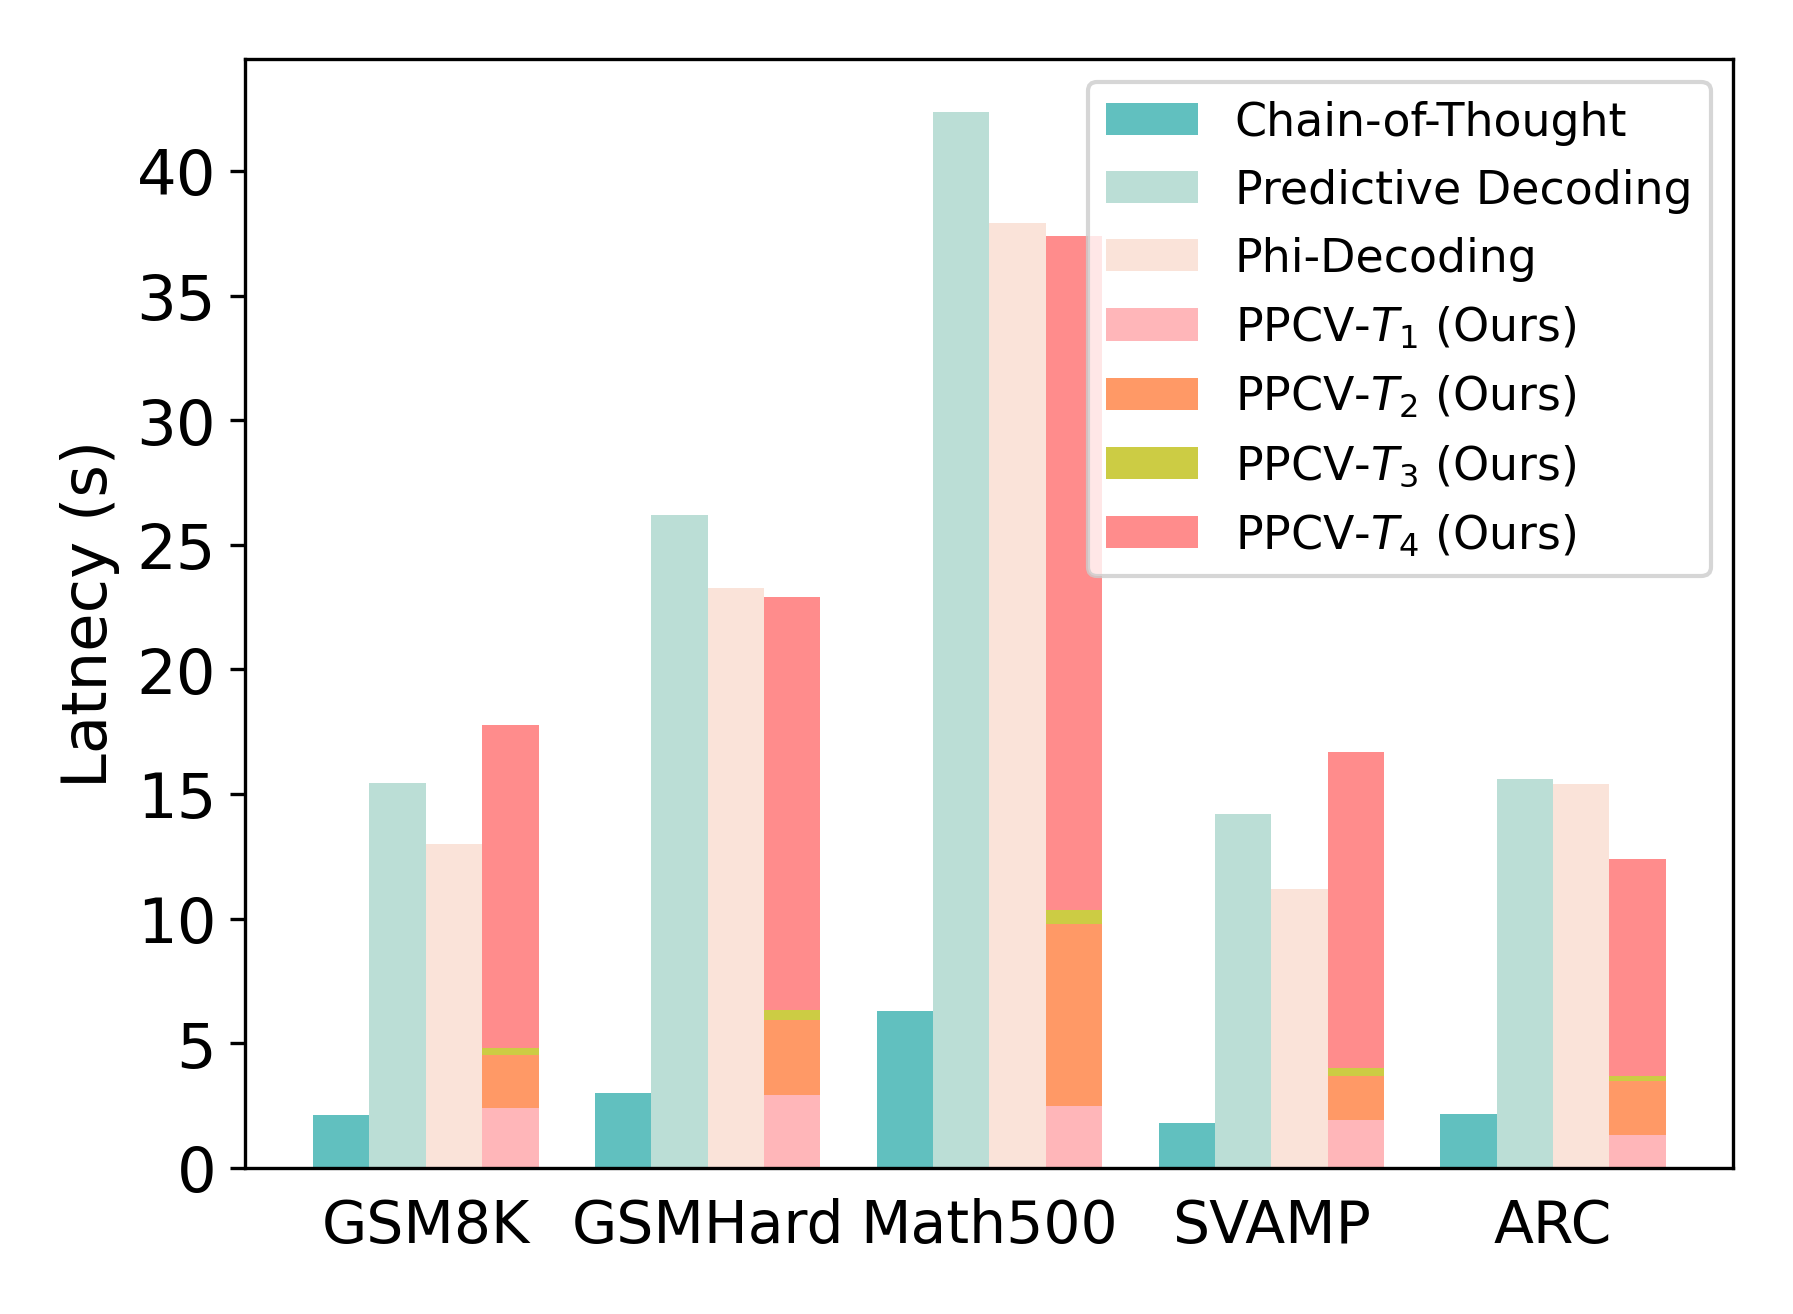
The image is a grouped bar chart comparing the latency (in seconds) of seven different decoding methods across five distinct datasets. The chart visually demonstrates the performance trade-offs between a baseline method (Chain-of-Thought), two existing methods (Predictive Decoding, Phi-Decoding), and four variants of a proposed method labeled "PPCV" (Ours).
### Components/Axes
* **Chart Type:** Grouped Bar Chart.
* **X-Axis (Categorical):** Represents five different evaluation datasets. From left to right: `GSM8K`, `GSMHard`, `Math500`, `SVAMP`, `ARC`.
* **Y-Axis (Numerical):** Labeled `Latency (s)`. The scale runs from 0 to approximately 43 seconds, with major tick marks at intervals of 5 seconds (0, 5, 10, 15, 20, 25, 30, 35, 40).
* **Legend:** Located in the top-right corner of the plot area. It defines seven data series by color:
1. `Chain-of-Thought` (Teal)
2. `Predictive Decoding` (Light Seafoam Green)
3. `Phi-Decoding` (Light Beige)
4. `PPCV-T₁ (Ours)` (Light Pink)
5. `PPCV-T₂ (Ours)` (Orange)
6. `PPCV-T₃ (Ours)` (Yellow-Green)
7. `PPCV-T₄ (Ours)` (Salmon Pink)
### Detailed Analysis
The latency values for each method across the datasets are approximate, derived from visual inspection of the bar heights against the y-axis.
**1. GSM8K Dataset:**
* Chain-of-Thought: ~2.0 s
* Predictive Decoding: ~15.5 s
* Phi-Decoding: ~13.0 s
* PPCV-T₁ (Ours): ~2.5 s
* PPCV-T₂ (Ours): ~4.8 s (stacked on T₁)
* PPCV-T₃ (Ours): ~5.0 s (stacked on T₂)
* PPCV-T₄ (Ours): ~17.8 s (stacked on T₃)
**2. GSMHard Dataset:**
* Chain-of-Thought: ~3.0 s
* Predictive Decoding: ~26.2 s
* Phi-Decoding: ~23.2 s
* PPCV-T₁ (Ours): ~3.0 s
* PPCV-T₂ (Ours): ~6.0 s (stacked on T₁)
* PPCV-T₃ (Ours): ~6.2 s (stacked on T₂)
* PPCV-T₄ (Ours): ~23.0 s (stacked on T₃)
**3. Math500 Dataset:**
* Chain-of-Thought: ~6.2 s
* Predictive Decoding: ~42.5 s (highest bar in the chart)
* Phi-Decoding: ~38.0 s
* PPCV-T₁ (Ours): ~2.5 s
* PPCV-T₂ (Ours): ~10.0 s (stacked on T₁)
* PPCV-T₃ (Ours): ~10.5 s (stacked on T₂)
* PPCV-T₄ (Ours): ~37.5 s (stacked on T₃)
**4. SVAMP Dataset:**
* Chain-of-Thought: ~1.8 s
* Predictive Decoding: ~14.2 s
* Phi-Decoding: ~11.2 s
* PPCV-T₁ (Ours): ~2.0 s
* PPCV-T₂ (Ours): ~4.0 s (stacked on T₁)
* PPCV-T₃ (Ours): ~4.2 s (stacked on T₂)
* PPCV-T₄ (Ours): ~16.8 s (stacked on T₃)
**5. ARC Dataset:**
* Chain-of-Thought: ~2.2 s
* Predictive Decoding: ~15.6 s
* Phi-Decoding: ~15.4 s
* PPCV-T₁ (Ours): ~1.2 s
* PPCV-T₂ (Ours): ~3.8 s (stacked on T₁)
* PPCV-T₃ (Ours): ~3.9 s (stacked on T₂)
* PPCV-T₄ (Ours): ~12.5 s (stacked on T₃)
**Note on PPCV Bars:** The bars for the four PPCV variants are **stacked** on top of each other for each dataset, forming a single composite bar. The total height of this composite bar represents the cumulative latency of the T₁ through T₄ components. The individual segment heights are listed above.
### Key Observations
1. **Consistent Baseline:** `Chain-of-Thought` consistently exhibits the lowest latency across all five datasets, ranging from ~1.8s to ~6.2s.
2. **High-Latency Methods:** `Predictive Decoding` and `Phi-Decoding` show significantly higher latency than Chain-of-Thought, with Predictive Decoding often being the slowest method (peaking at ~42.5s on Math500).
3. **PPCV Variant Performance:** The latency of the proposed `PPCV` method varies dramatically by its configuration (T₁ to T₄).
* `PPCV-T₁` is very fast, comparable to Chain-of-Thought.
* `PPCV-T₂` and `PPCV-T₃` add moderate latency.
* `PPCV-T₄` contributes the vast majority of the latency in the composite PPCV bar, making the total latency for the full PPCV stack often comparable to or exceeding Phi-Decoding and Predictive Decoding (e.g., on GSM8K, GSMHard, SVAMP).
4. **Dataset Difficulty:** The `Math500` dataset elicits the highest latency from all methods except Chain-of-Thought, suggesting it is the most computationally demanding task among those tested.
### Interpretation
This chart is a performance analysis from a research paper, likely evaluating a new decoding method called **PPCV**. The key takeaway is a **latency-accuracy trade-off**. The authors are demonstrating that their method can be configured for different operating points:
* **Low-Latency Mode (`PPCV-T₁`):** Achieves speed comparable to the simple Chain-of-Thought baseline.
* **High-Latency/High-Accuracy Mode (Full `PPCV-T₄` stack):** Incurs latency similar to or greater than existing complex methods like Predictive Decoding and Phi-Decoding. The implication is that this higher latency configuration likely yields better accuracy or reasoning quality, which would be shown in a separate accuracy chart.
The stacking of the PPCV bars visually emphasizes that the latency cost is additive across its components (T₁ through T₄). The chart effectively argues that the PPCV framework is flexible, allowing users to choose a configuration that balances speed against the desired level of performance (presumably accuracy). The outlier performance on `Math500` highlights that the computational cost of advanced decoding is highly dependent on the complexity of the problem domain.