## Chart Type: Receiver Operating Characteristic (ROC) Curves
### Overview
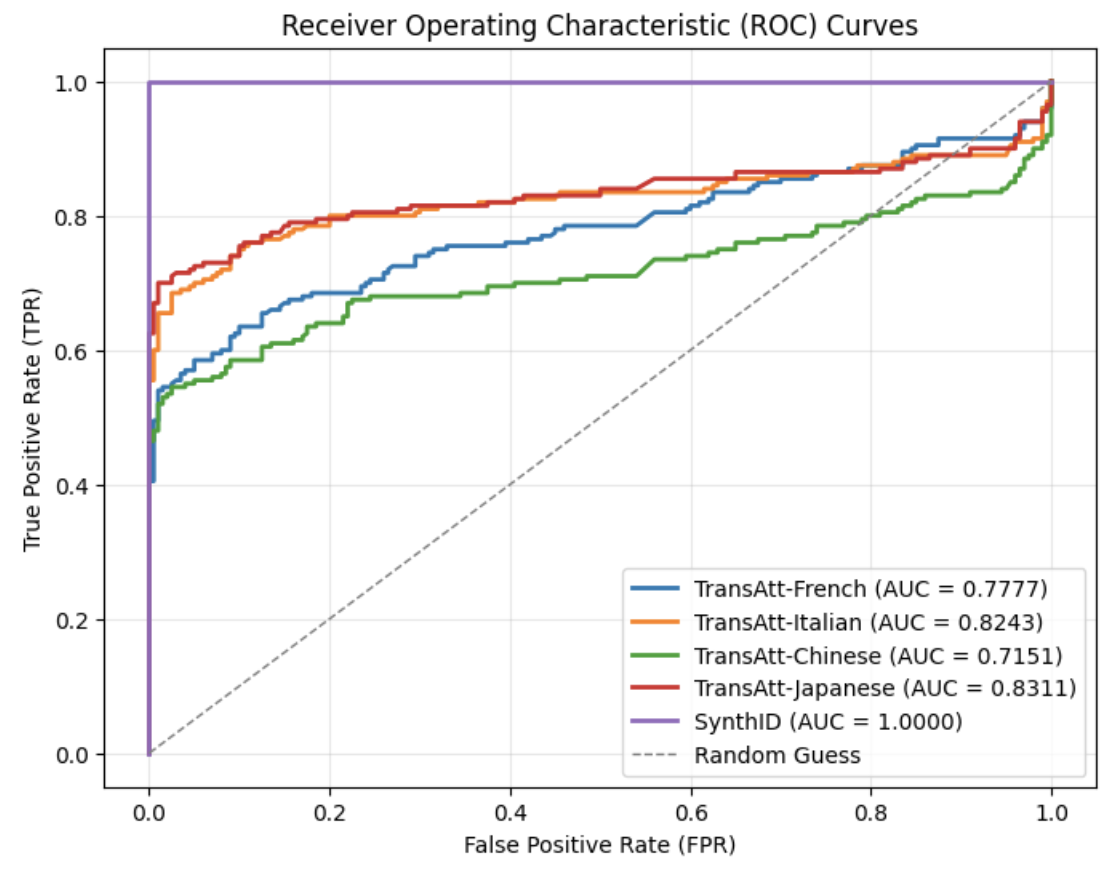
The image is a Receiver Operating Characteristic (ROC) curve chart, comparing the performance of different models (TransAtt-French, TransAtt-Italian, TransAtt-Chinese, TransAtt-Japanese, and SynthID) against a random guess baseline. The chart plots the True Positive Rate (TPR) against the False Positive Rate (FPR). The Area Under the Curve (AUC) is provided for each model in the legend.
### Components/Axes
* **Title:** Receiver Operating Characteristic (ROC) Curves
* **X-axis:** False Positive Rate (FPR), ranging from 0.0 to 1.0 in increments of 0.2.
* **Y-axis:** True Positive Rate (TPR), ranging from 0.0 to 1.0 in increments of 0.2.
* **Legend:** Located in the bottom-right corner, it identifies each model and its corresponding AUC score:
* TransAtt-French (AUC = 0.7777) - Blue line
* TransAtt-Italian (AUC = 0.8243) - Orange line
* TransAtt-Chinese (AUC = 0.7151) - Green line
* TransAtt-Japanese (AUC = 0.8311) - Red line
* SynthID (AUC = 1.0000) - Purple line
* Random Guess - Dashed gray line
### Detailed Analysis
* **TransAtt-French (Blue):** Starts at approximately (0, 0.42), rises to approximately (0.2, 0.75), then gradually increases to approximately (1.0, 0.92).
* **TransAtt-Italian (Orange):** Starts at approximately (0, 0.68), rises to approximately (0.2, 0.80), then gradually increases to approximately (1.0, 0.95).
* **TransAtt-Chinese (Green):** Starts at approximately (0, 0.55), rises to approximately (0.2, 0.65), then gradually increases to approximately (1.0, 0.90).
* **TransAtt-Japanese (Red):** Starts at approximately (0, 0.72), rises to approximately (0.2, 0.82), then gradually increases to approximately (1.0, 0.94).
* **SynthID (Purple):** Rises vertically from (0, 0) to (0, 1), then runs horizontally to (1, 1).
* **Random Guess (Dashed Gray):** A diagonal line from (0, 0) to (1, 1).
### Key Observations
* SynthID has the highest AUC (1.0000), indicating perfect classification performance.
* TransAtt-Japanese has the second-highest AUC (0.8311), followed by TransAtt-Italian (0.8243), TransAtt-French (0.7777), and TransAtt-Chinese (0.7151).
* All models outperform the random guess baseline.
* The ROC curves show the trade-off between TPR and FPR for each model.
### Interpretation
The ROC curves visually represent the performance of different models in distinguishing between positive and negative cases. The AUC scores quantify this performance, with higher scores indicating better discrimination. SynthID achieves perfect classification, while the other models demonstrate varying degrees of accuracy. The curves show how the true positive rate changes as the false positive rate increases, allowing for a comparison of the models' sensitivity and specificity. The further the curve is from the random guess line, the better the model's performance.