## Chart/Diagram Type: Receiver Operating Characteristic (ROC) Curves
### Overview
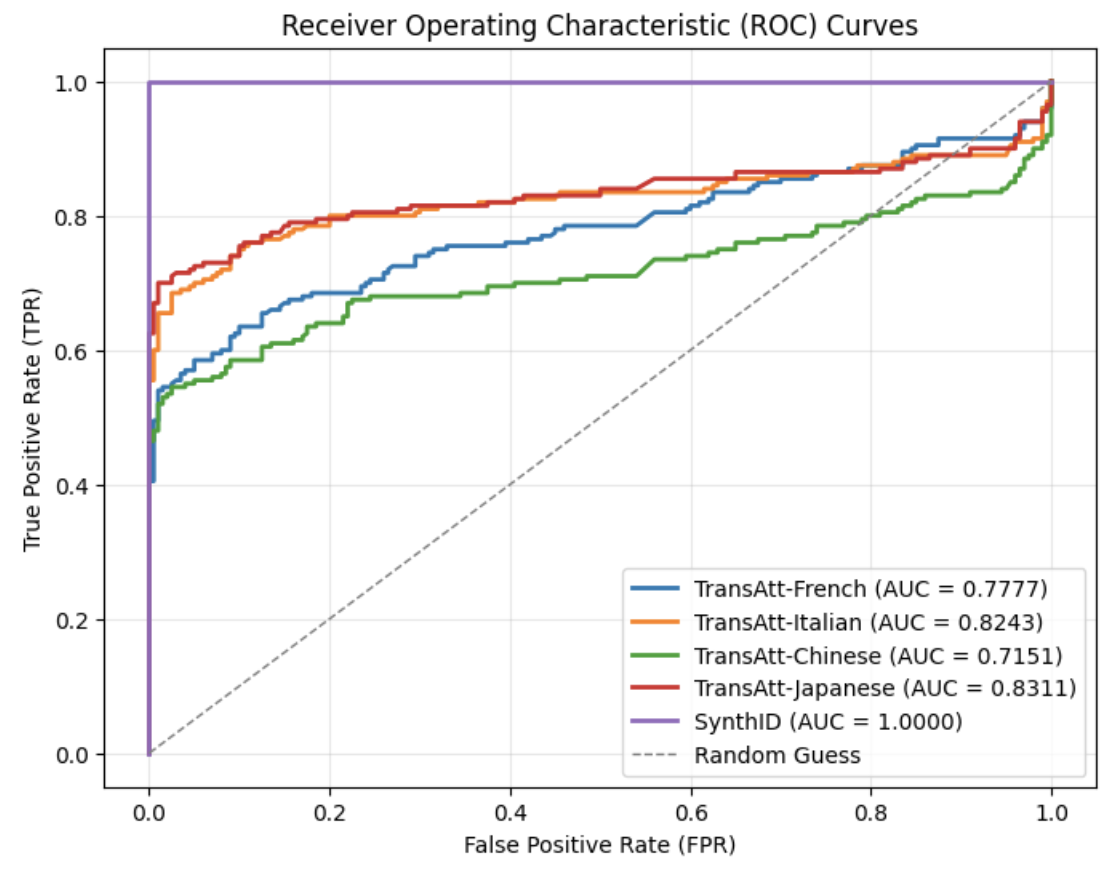
The image displays a Receiver Operating Characteristic (ROC) curve chart comparing the performance of multiple classification models. The chart evaluates models based on their ability to distinguish between classes, with the x-axis representing the False Positive Rate (FPR) and the y-axis representing the True Positive Rate (TPR). A diagonal dashed line (Random Guess) serves as a baseline, while a perfect classifier is represented by a curve along the top-left corner.
### Components/Axes
- **X-axis**: False Positive Rate (FPR), ranging from 0.0 to 1.0.
- **Y-axis**: True Positive Rate (TPR), ranging from 0.0 to 1.0.
- **Legend**: Located in the bottom-right corner, with the following entries:
- **TransAtt-French** (blue, AUC = 0.7777)
- **TransAtt-Italian** (orange, AUC = 0.8243)
- **TransAtt-Chinese** (green, AUC = 0.7151)
- **TransAtt-Japanese** (red, AUC = 0.8311)
- **SynthID** (purple, AUC = 1.0000)
- **Random Guess** (dashed gray line).
### Detailed Analysis
1. **TransAtt-French (blue)**:
- Starts at (0, 0) and rises gradually, reaching ~0.8 TPR at ~0.6 FPR.
- AUC = 0.7777, indicating moderate performance.
2. **TransAtt-Italian (orange)**:
- Slightly outperforms TransAtt-French, with a steeper slope.
- Reaches ~0.85 TPR at ~0.6 FPR.
- AUC = 0.8243.
3. **TransAtt-Chinese (green)**:
- The flattest curve among TransAtt models.
- Reaches ~0.75 TPR at ~0.6 FPR.
- AUC = 0.7151, the lowest among TransAtt models.
4. **TransAtt-Japanese (red)**:
- The steepest TransAtt curve, closely following SynthID.
- Reaches ~0.9 TPR at ~0.6 FPR.
- AUC = 0.8311, the highest among TransAtt models.
5. **SynthID (purple)**:
- A perfect classifier, represented by a horizontal line at TPR = 1.0.
- AUC = 1.0000.
6. **Random Guess (dashed gray)**:
- A diagonal line from (0, 0) to (1, 1), representing random performance.
### Key Observations
- **SynthID** is the only model achieving perfect performance (AUC = 1.0000), suggesting it is a synthetic or idealized model.
- **TransAtt-Japanese** (red) outperforms all other TransAtt models, with the highest AUC (0.8311).
- **TransAtt-Chinese** (green) has the lowest performance among TransAtt models (AUC = 0.7151).
- All TransAtt models outperform the Random Guess line, confirming their utility.
- The curves for TransAtt models show varying trade-offs between FPR and TPR, with Japanese and Italian models being the most effective.
### Interpretation
The chart demonstrates that **SynthID** is the most effective model, likely representing an idealized or synthetic benchmark. Among the TransAtt models, **Japanese** and **Italian** variants show superior performance, while **Chinese** lags behind. The AUC values quantify these differences, with higher values indicating better class separation. The Random Guess line underscores that all models outperform chance. The spatial positioning of the curves (e.g., Japanese curve’s steepness) visually reinforces their relative effectiveness. This analysis highlights the importance of model selection based on language-specific performance metrics.