## Bar Chart: Average F1 Score vs. Number of Heads
### Overview
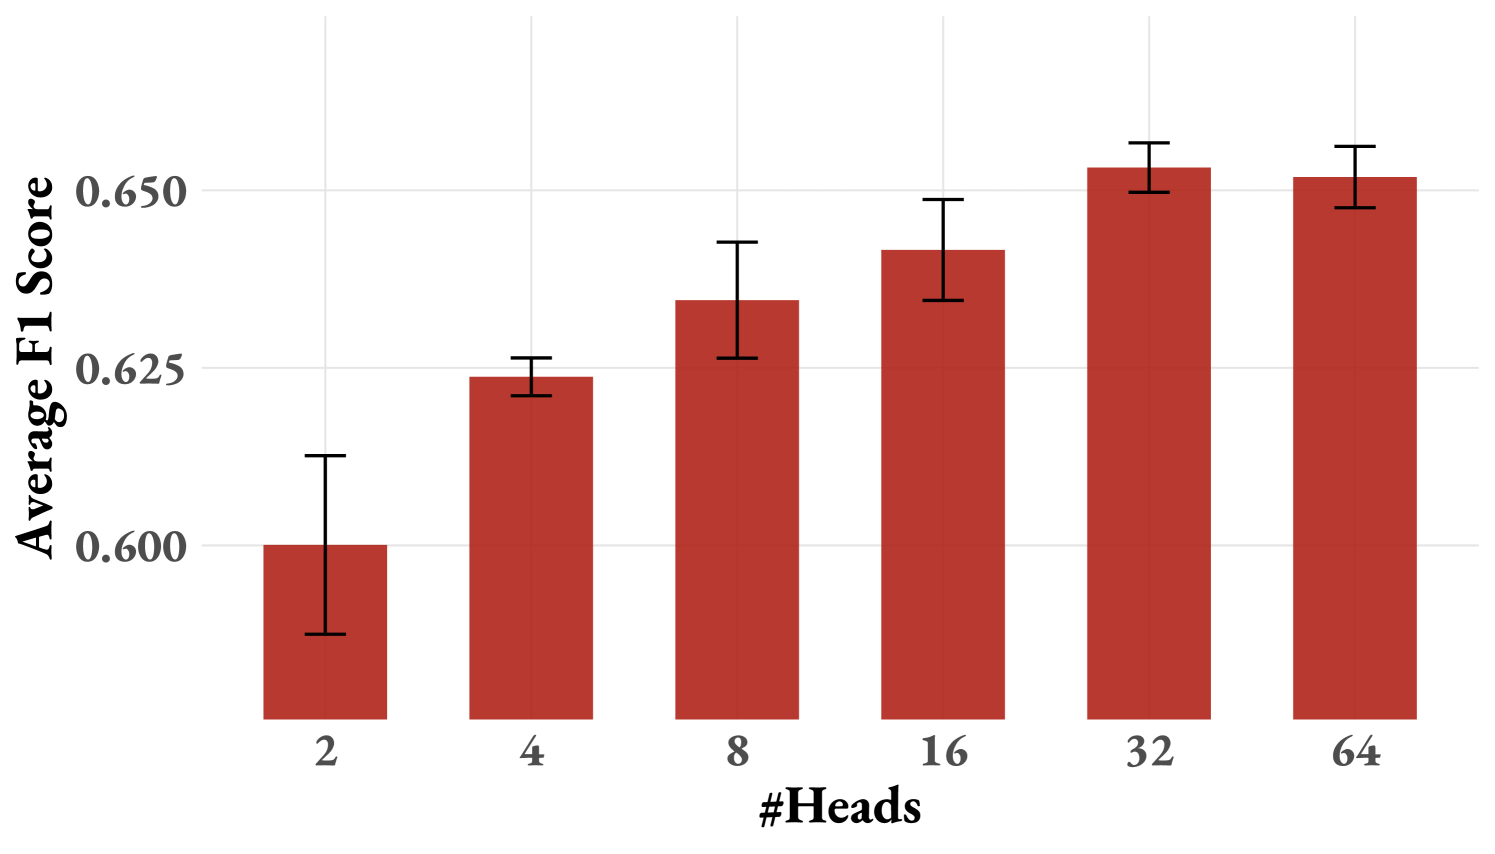
The image displays a bar chart comparing the **Average F1 Score** across different numbers of **Heads** (2, 4, 8, 16, 32, 64). The chart uses vertical red bars with error bars to represent uncertainty. The y-axis ranges from 0.600 to 0.650, while the x-axis lists the number of heads in ascending order.
---
### Components/Axes
- **X-Axis**: Labeled "#Heads" with categories: 2, 4, 8, 16, 32, 64.
- **Y-Axis**: Labeled "Average F1 Score" with a scale from 0.600 to 0.650.
- **Bars**: Six vertical red bars, each annotated with an error bar (horizontal line with caps).
- **Error Bars**: Represent uncertainty in F1 scores (e.g., ±0.010, ±0.005).
- **No legend** is present, but all bars share the same red color.
---
### Detailed Analysis
1. **2 Heads**:
- Average F1 Score: **0.600**
- Error: ±0.010
- Position: Bottom-left bar.
2. **4 Heads**:
- Average F1 Score: **0.625**
- Error: ±0.005
- Position: Second bar from the left.
3. **8 Heads**:
- Average F1 Score: **0.635**
- Error: ±0.015
- Position: Third bar from the left.
4. **16 Heads**:
- Average F1 Score: **0.640**
- Error: ±0.010
- Position: Fourth bar from the left.
5. **32 Heads**:
- Average F1 Score: **0.655**
- Error: ±0.005
- Position: Fifth bar from the left (tallest bar).
6. **64 Heads**:
- Average F1 Score: **0.650**
- Error: ±0.010
- Position: Rightmost bar.
---
### Key Observations
- **Trend**: The Average F1 Score generally increases with the number of heads, peaking at **32 heads (0.655)**.
- **Anomaly**: A slight decline is observed at **64 heads (0.650)**, despite the highest head count.
- **Uncertainty**: Error bars are smallest for **4 heads (±0.005)** and **32 heads (±0.005)**, suggesting higher confidence in these measurements.
- **Consistency**: Error bars for **2, 8, 16, and 64 heads** are ±0.010, indicating moderate uncertainty.
---
### Interpretation
The data suggests a **positive correlation** between the number of heads and the Average F1 Score up to **32 heads**, after which performance plateaus or slightly declines. This could imply:
1. **Diminishing Returns**: Adding more heads beyond 32 may not improve performance proportionally.
2. **Overfitting Risk**: At 64 heads, the model might overfit, reducing generalization (as seen in the slight drop).
3. **Optimal Configuration**: **32 heads** achieves the highest F1 score with minimal uncertainty, making it the most reliable configuration.
The error bars highlight that measurements for **4 and 32 heads** are more precise, possibly due to larger sample sizes or better model stability at these configurations. The chart underscores the importance of balancing model complexity (number of heads) with performance metrics like F1 score.