## Bar Chart: Average F1 Score vs. Number of Heads
### Overview
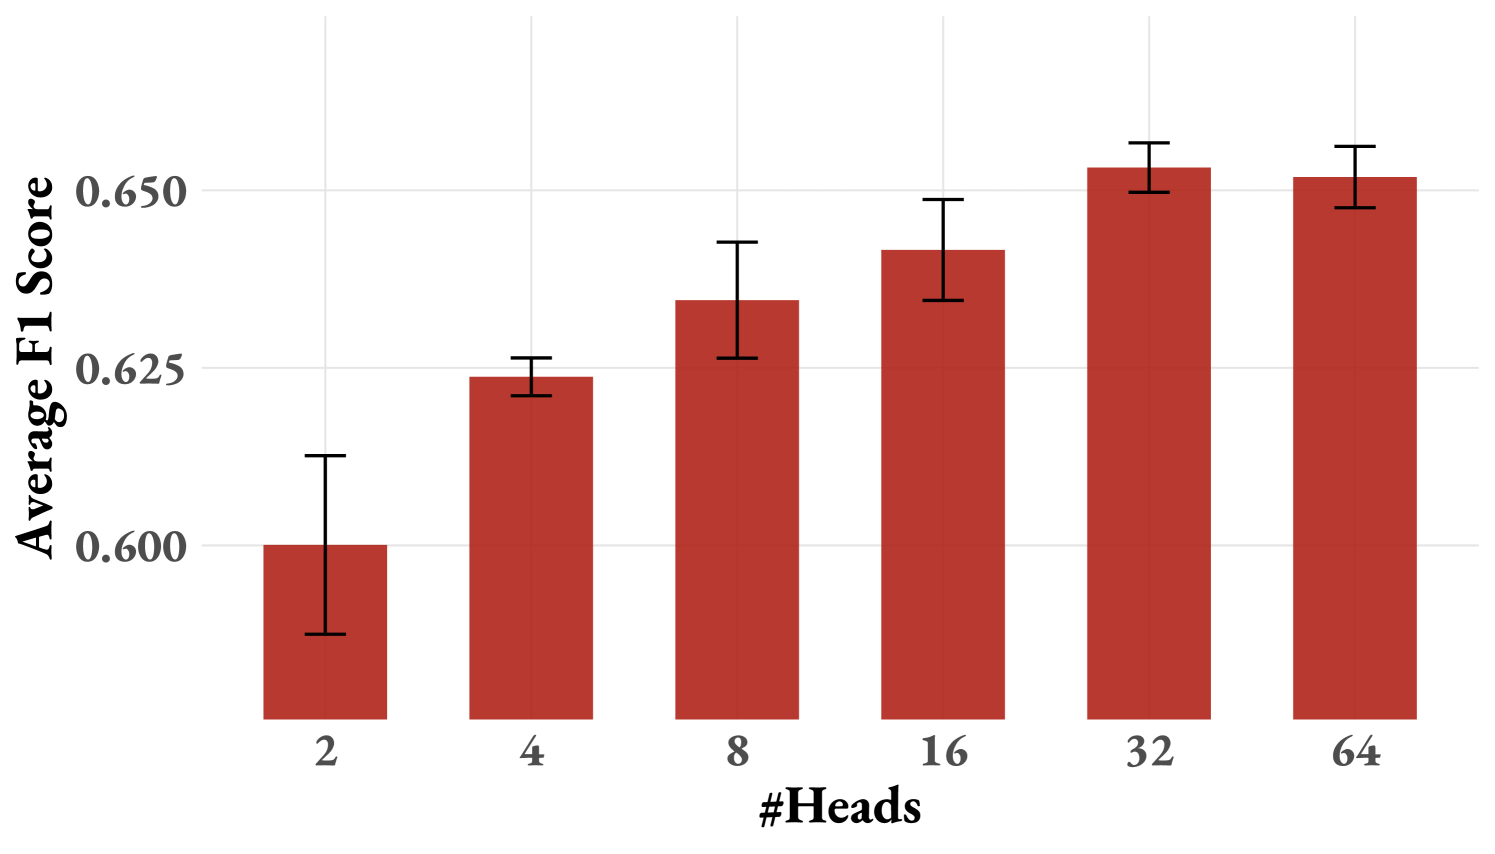
The image is a bar chart showing the relationship between the average F1 score and the number of heads. The chart displays red bars representing the average F1 score for different numbers of heads (2, 4, 8, 16, 32, and 64). Error bars are included on each bar to indicate the variability or uncertainty in the F1 score.
### Components/Axes
* **X-axis:** "#Heads" with values 2, 4, 8, 16, 32, and 64.
* **Y-axis:** "Average F1 Score" with values ranging from 0.600 to 0.650, with a gridline at 0.625.
* **Bars:** Red bars representing the average F1 score for each number of heads.
* **Error Bars:** Black vertical lines extending above and below each bar, indicating the standard deviation or confidence interval.
### Detailed Analysis
The chart shows how the average F1 score changes as the number of heads increases.
* **#Heads = 2:** Average F1 Score is approximately 0.600, with an error bar extending from approximately 0.585 to 0.615.
* **#Heads = 4:** Average F1 Score is approximately 0.624, with an error bar extending from approximately 0.618 to 0.630.
* **#Heads = 8:** Average F1 Score is approximately 0.635, with an error bar extending from approximately 0.628 to 0.642.
* **#Heads = 16:** Average F1 Score is approximately 0.638, with an error bar extending from approximately 0.632 to 0.644.
* **#Heads = 32:** Average F1 Score is approximately 0.653, with an error bar extending from approximately 0.647 to 0.659.
* **#Heads = 64:** Average F1 Score is approximately 0.652, with an error bar extending from approximately 0.646 to 0.658.
### Key Observations
* The average F1 score generally increases as the number of heads increases from 2 to 32.
* The average F1 score plateaus or slightly decreases when the number of heads increases from 32 to 64.
* The error bars suggest that the variability in F1 score is relatively consistent across different numbers of heads.
### Interpretation
The data suggests that increasing the number of heads initially improves the average F1 score, indicating better model performance. However, there appears to be a point of diminishing returns, as increasing the number of heads beyond 32 does not lead to a significant improvement and may even slightly decrease the F1 score. This could be due to overfitting or increased complexity without a corresponding increase in useful information. The error bars provide an indication of the uncertainty in these average scores, which should be considered when drawing conclusions.