\n
## Diagram: Awareness Categories and Associated Research
### Overview
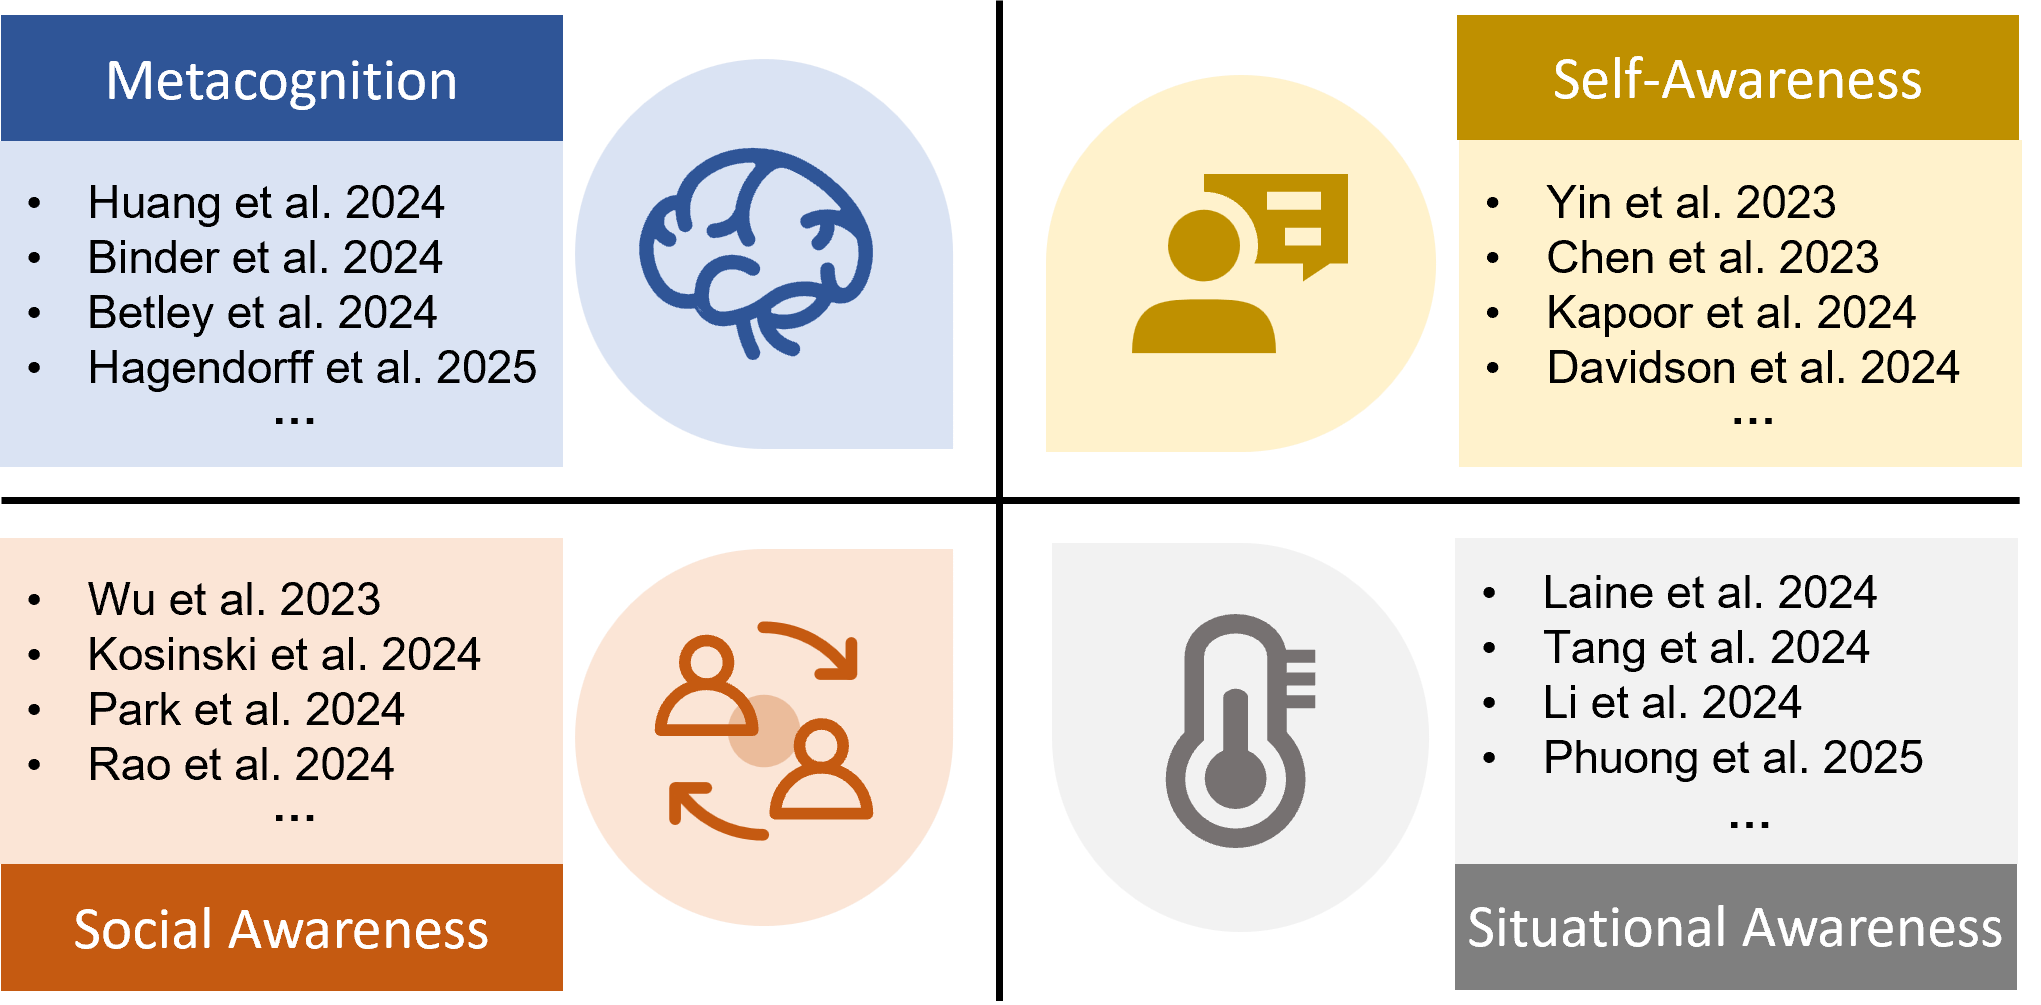
The image is a diagram divided into four quadrants, each representing a different category of awareness: Metacognition, Self-Awareness, Social Awareness, and Situational Awareness. Each quadrant lists several research papers (identified by author and year) associated with that category. The diagram uses color-coding to distinguish the categories and includes illustrative icons within each quadrant.
### Components/Axes
The diagram consists of four main quadrants arranged in a 2x2 grid. Each quadrant has:
* **Title:** A category name (Metacognition, Self-Awareness, Social Awareness, Situational Awareness) displayed in bold text at the top.
* **List of Research:** A bulleted list of research papers, formatted as "Author et al. Year". Each list includes an ellipsis ("...") indicating that the list is not exhaustive.
* **Icon:** A visual representation of the awareness category.
* **Color:** Each quadrant is filled with a distinct color:
* Metacognition: Blue
* Self-Awareness: Yellow
* Social Awareness: Orange
* Situational Awareness: Light Green
### Detailed Analysis or Content Details
**1. Metacognition (Blue Quadrant - Top Left)**
* Icon: A stylized brain with interconnected lines.
* Research Papers:
* Huang et al. 2024
* Binder et al. 2024
* Betley et al. 2024
* Hagendorff et al. 2025
* ...
**2. Self-Awareness (Yellow Quadrant - Top Right)**
* Icon: A head silhouette with a graduation cap.
* Research Papers:
* Yin et al. 2023
* Chen et al. 2023
* Kapoor et al. 2024
* Davidson et al. 2024
* ...
**3. Social Awareness (Orange Quadrant - Bottom Left)**
* Icon: Two person silhouettes with circular arrows between them.
* Research Papers:
* Wu et al. 2023
* Kosinski et al. 2024
* Park et al. 2024
* Rao et al. 2024
* ...
**4. Situational Awareness (Light Green Quadrant - Bottom Right)**
* Icon: A thermometer-like shape.
* Research Papers:
* Laine et al. 2024
* Tang et al. 2024
* Li et al. 2024
* Phuong et al. 2025
* ...
### Key Observations
* The diagram presents a categorization of different types of awareness.
* Each category is linked to recent research (2023-2025).
* The use of icons provides a visual cue for each awareness type.
* The ellipsis ("...") suggests that the listed research is not a complete representation of the field.
* The years of publication are increasing, suggesting ongoing research in these areas.
### Interpretation
The diagram illustrates the different facets of awareness and highlights the active research being conducted in each area. The categorization suggests a framework for understanding and studying awareness, potentially within the context of artificial intelligence, psychology, or human-computer interaction. The inclusion of publication years indicates the dynamic nature of these fields and the continuous development of new insights. The icons are symbolic representations of each awareness type, aiding in quick comprehension. The diagram doesn't present quantitative data or trends, but rather serves as a qualitative overview of the research landscape related to different awareness categories. It implies that each type of awareness is a distinct area of study with its own body of research.