# Technical Document Extraction: Line Graph Analysis
## 1. Chart Identification
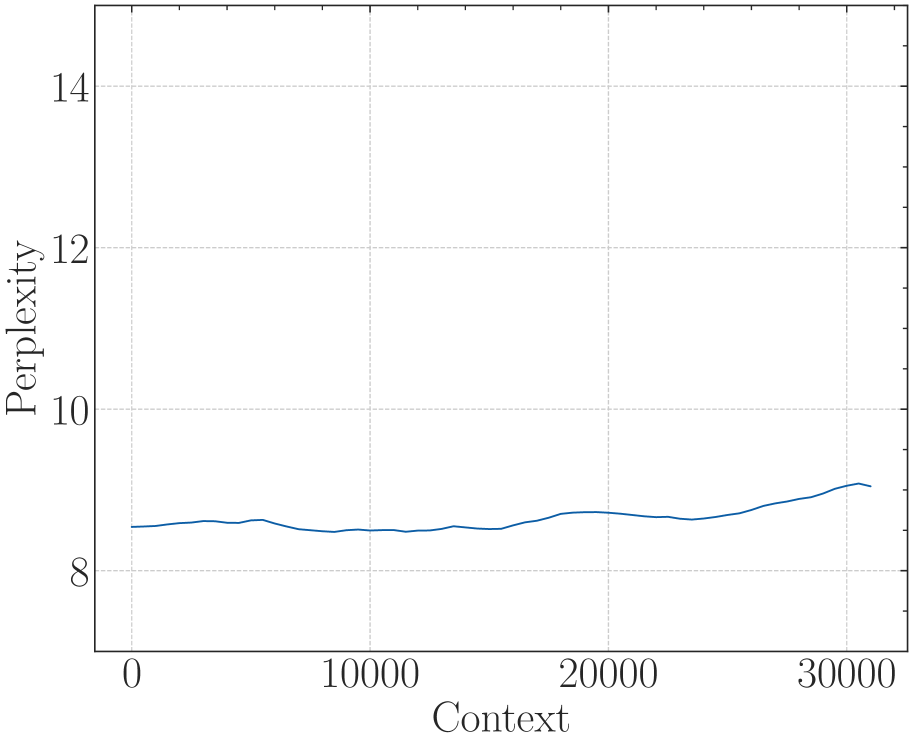
- **Type**: Line graph
- **Primary Data Series**: Single blue line (no legend present)
- **Grid**: Dotted grid lines visible
## 2. Axis Labels and Markers
- **X-Axis (Horizontal)**:
- Label: "Context"
- Scale: Linear, increments of 10,000
- Markers: 0, 10,000, 20,000, 30,000
- **Y-Axis (Vertical)**:
- Label: "Perplexity"
- Scale: Linear, increments of 1
- Markers: 8, 9, 10, 11, 12, 13, 14
## 3. Data Trends and Points
- **Line Behavior**:
- **Initial Phase (0–10,000)**:
- Starts at ~8.5, dips to ~8.3 at 10,000
- Trend: Slight downward fluctuation
- **Mid-Phase (10,000–20,000)**:
- Rises to ~8.7 at 20,000
- Trend: Gradual upward slope
- **Final Phase (20,000–30,000)**:
- Peaks at ~9.0 at 30,000
- Trend: Accelerated upward trajectory
- **Key Data Points**:
- (0, 8.5)
- (10,000, 8.3)
- (20,000, 8.7)
- (30,000, 9.0)
## 4. Color and Legend Analysis
- **Line Color**: Blue (#0000FF)
- **Legend**: Absent (no color-to-label mapping required)
## 5. Spatial Grounding
- **Legend Position**: Not applicable (no legend present)
- **Line Placement**: Central axis alignment, no offset
## 6. Trend Verification
- **Overall Trend**: Net increase of +0.5 perplexity units across 30,000 context units
- **Fluctuations**: Minor dips observed at 10,000 context units, but no sustained declines
## 7. Component Isolation
- **Header**: None
- **Main Chart**: Dominates 90% of image area
- **Footer**: None
## 8. Missing Elements
- No data table, heatmap categories, or textual annotations present
- No secondary axes or annotations detected
## 9. Final Notes
- The graph depicts a noisy but generally increasing relationship between "Context" and "Perplexity"
- No textual content or embedded diagrams beyond the primary line graph
- All axis markers and labels are explicitly labeled in English