# Technical Document Extraction: Perplexity vs. Context Chart
## 1. Component Isolation
* **Header:** None present.
* **Main Chart Area:** A line graph plotted on a Cartesian coordinate system with a light gray dashed grid.
* **Axes:**
* **Y-Axis (Vertical):** Labeled "Perplexity".
* **X-Axis (Horizontal):** Labeled "Context".
* **Footer:** None present.
## 2. Axis and Label Extraction
### Y-Axis: Perplexity
* **Label:** Perplexity
* **Major Tick Markers:** 8, 10, 12, 14
* **Minor Tick Markers:** Present at intervals of 0.5 units (e.g., 7.5, 8.5, 9.5, etc.).
* **Range:** The visible scale starts at approximately 7.0 and ends at 15.0.
### X-Axis: Context
* **Label:** Context
* **Major Tick Markers:** 0, 10000, 20000, 30000
* **Minor Tick Markers:** Present at intervals of 2000 units (e.g., 2000, 4000, 6000, 8000).
* **Range:** The visible scale starts at 0 and ends slightly past 30000 (approx. 32000).
## 3. Data Series Analysis
### Series 1: Blue Line
* **Color:** Dark Blue (#1f4e79 approx.)
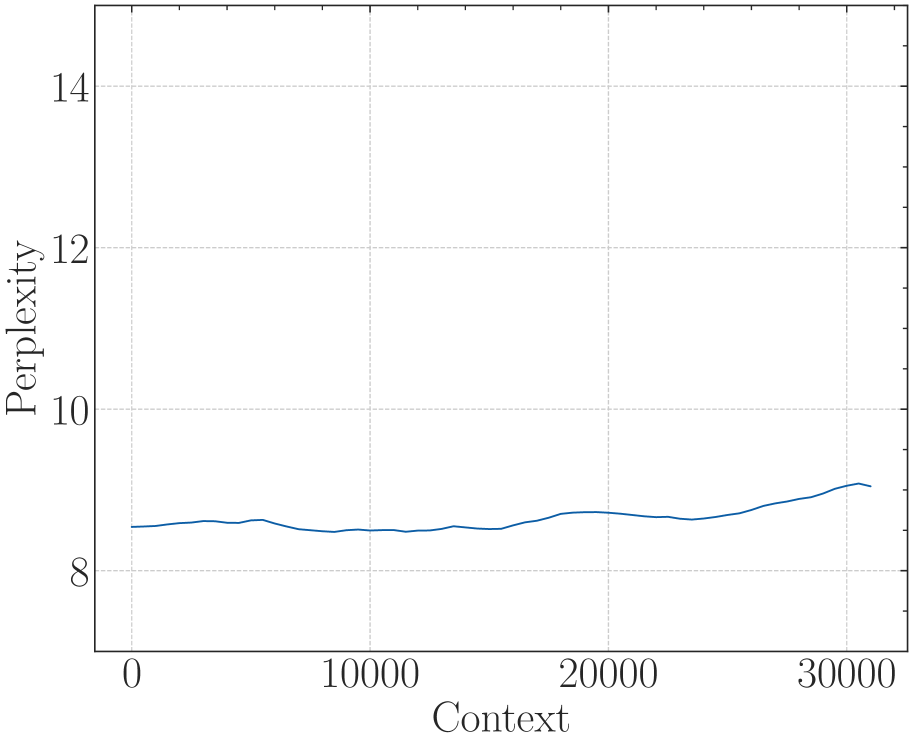
* **Trend Verification:** The line exhibits a "flat-to-slightly-rising" trend. It begins with minor oscillations between 0 and 15,000 context, maintains a very stable baseline, and shows a gradual, steady upward slope starting after the 25,000 context mark.
* **Key Data Points (Estimated):**
| Context | Perplexity (Approx.) |
| :--- | :--- |
| 0 | 8.5 |
| 5,000 | 8.6 |
| 10,000 | 8.5 |
| 15,000 | 8.5 |
| 20,000 | 8.7 |
| 25,000 | 8.7 |
| 30,000 | 9.1 |
| 31,000 | 9.0 |
## 4. Summary of Information
This chart illustrates the relationship between "Context" (likely context window size in a Large Language Model) and "Perplexity" (a measurement of how well a probability model predicts a sample).
The most significant technical takeaway is the **stability of the model**. While many models see a sharp increase in perplexity (degradation in performance) as context length increases, this specific data shows that the perplexity remains remarkably consistent between 8.5 and 9.1 across a context range of 0 to 30,000+ tokens. The slight upward trend at the end suggests the beginning of a performance trade-off as the context window reaches its upper limits.