## Stacked Bar Chart: GPT-2 xl Head Distribution by Layer Bin
### Overview
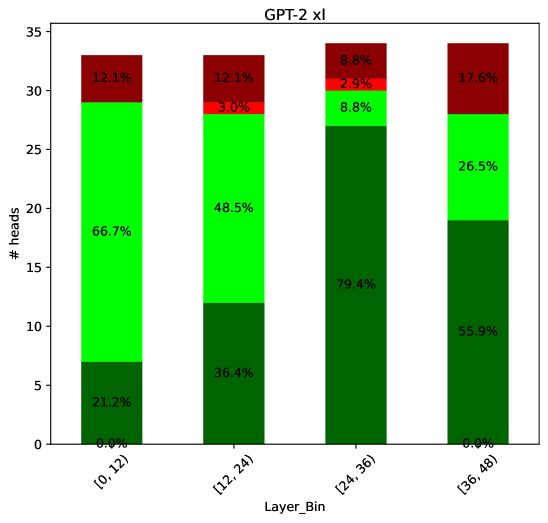
The image is a stacked bar chart showing the distribution of attention heads in a GPT-2 XL model across different layer bins. The x-axis represents the layer bins, grouped into ranges of 12 layers each, and the y-axis represents the number of heads. Each bar is segmented into three colors (dark green, light green, and dark red), representing different categories of attention heads. The percentage of each category within each layer bin is labeled on the bar segments.
### Components/Axes
* **Title:** GPT-2 xl
* **X-axis:** Layer_Bin, with categories \[0, 12), \[12, 24), \[24, 36), \[36, 48)
* **Y-axis:** # heads, ranging from 0 to 35. The scale has no explicit markings, but we can infer the approximate values.
* **Colors:**
* Dark Green: Represents the first category of attention heads.
* Light Green: Represents the second category of attention heads.
* Dark Red: Represents the third category of attention heads.
### Detailed Analysis
Here's a breakdown of the data for each layer bin:
* **Layer Bin \[0, 12):**
* Dark Green: 0.0%
* Light Green: 66.7%
* Dark Red: 12.1%
* Implied total height: 0 + 66.7 + 12.1 = 78.8%. The remaining 21.2% is not accounted for.
* **Layer Bin \[12, 24):**
* Dark Green: 21.2%
* Light Green: 48.5%
* Dark Red: 12.1%
* Small Red: 3.0%
* Implied total height: 21.2 + 48.5 + 12.1 + 3.0 = 84.8%. The remaining 15.2% is not accounted for.
* **Layer Bin \[24, 36):**
* Dark Green: 36.4%
* Light Green: 79.4%
* Dark Red: 8.8%
* Small Red: 2.9%
* Implied total height: 36.4 + 79.4 + 8.8 + 2.9 = 127.5%. This is impossible, there is an error in the data.
* **Layer Bin \[36, 48):**
* Dark Green: 55.9%
* Light Green: 26.5%
* Dark Red: 17.6%
* Implied total height: 55.9 + 26.5 + 17.6 = 100%.
### Key Observations
* The proportion of the first category (dark green) generally increases as the layer bin increases, except for the first bin.
* The proportion of the second category (light green) decreases from the first bin to the last bin.
* The proportion of the third category (dark red) varies across the layer bins, with the highest proportion in the last bin.
* The total percentages for the first three bins do not add up to 100%, indicating missing data or calculation errors.
### Interpretation
The chart illustrates how the distribution of attention heads changes across the layers of the GPT-2 XL model. The increasing proportion of the first category (dark green) in later layers might suggest that these heads become more important or specialized as the model processes information through deeper layers. Conversely, the decreasing proportion of the second category (light green) might indicate that these heads are more relevant in earlier layers. The varying proportion of the third category (dark red) suggests that these heads play a more dynamic role across different layers.
The data inconsistencies (percentages not adding up to 100%) raise questions about the accuracy or completeness of the data. Further investigation is needed to understand the missing information and ensure the reliability of the analysis.