\n
## Stacked Bar Chart: GPT-2 xl Layer Head Distribution
### Overview
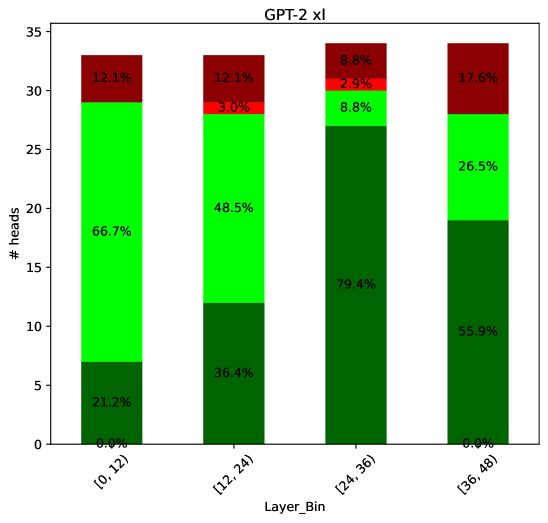
This is a stacked bar chart visualizing the distribution of attention heads across different layers of the GPT-2 xl model. The x-axis represents layer bins, and the y-axis represents the number of heads. Each bar is segmented into three colored sections, representing different proportions within each layer bin. The chart aims to show how the attention heads are distributed across the layers of the model.
### Components/Axes
* **Title:** GPT-2 xl
* **X-axis Label:** Layer\_Bin
* **X-axis Categories:** \[0, 12], \[12, 24], \[24, 36], \[36, 48]
* **Y-axis Label:** # heads
* **Y-axis Scale:** 0 to 35 (approximately)
* **Legend:** Implicitly defined by color:
* Red: Represents a percentage of heads.
* Green: Represents a percentage of heads.
* Dark Green: Represents a percentage of heads.
### Detailed Analysis
The chart consists of four stacked bars, one for each layer bin. The height of each bar represents the total number of heads within that bin. The segments within each bar indicate the proportion of heads belonging to each color category.
* **\[0, 12] Layer Bin:**
* Red segment: 12.1% of heads.
* Green segment: 66.7% of heads.
* Dark Green segment: 21.2% of heads.
* Total heads (approx.): 34
* **\[12, 24] Layer Bin:**
* Red segment: 12.1% of heads.
* Green segment: 48.5% of heads.
* Dark Green segment: 36.4% of heads.
* Total heads (approx.): 28
* **\[24, 36] Layer Bin:**
* Red segment: 8.8% of heads.
* Green segment: 79.4% of heads.
* Dark Green segment: 8.8% of heads.
* Total heads (approx.): 26
* **\[36, 48] Layer Bin:**
* Red segment: 17.6% of heads.
* Green segment: 26.5% of heads.
* Dark Green segment: 55.9% of heads.
* Total heads (approx.): 30
### Key Observations
* The distribution of heads varies significantly across layer bins.
* The \[24, 36] layer bin has the highest proportion of heads in the green category (79.4%).
* The \[0, 12] layer bin has the highest proportion of heads in the green category (66.7%).
* The \[36, 48] layer bin has the highest proportion of heads in the dark green category (55.9%).
* The red segment is relatively consistent across all layer bins, ranging from 8.8% to 17.6%.
### Interpretation
The chart suggests that the attention heads are not uniformly distributed across the layers of the GPT-2 xl model. The dominance of the green category in the \[24, 36] layer bin might indicate a particular pattern of attention or information processing within those layers. The varying proportions of heads in each color category across different layer bins could reflect the hierarchical nature of the model and the different roles played by different layers in processing information. The relatively consistent red segment suggests a baseline level of attention across all layers. The chart provides insights into the internal workings of the model and could be used to understand how different layers contribute to its overall performance. The data suggests that the model's attention mechanism evolves as information flows through the layers, with certain layers focusing on different aspects of the input.