# Technical Document Extraction: Flowchart Diagram Analysis
## 1. Diagram Structure Overview
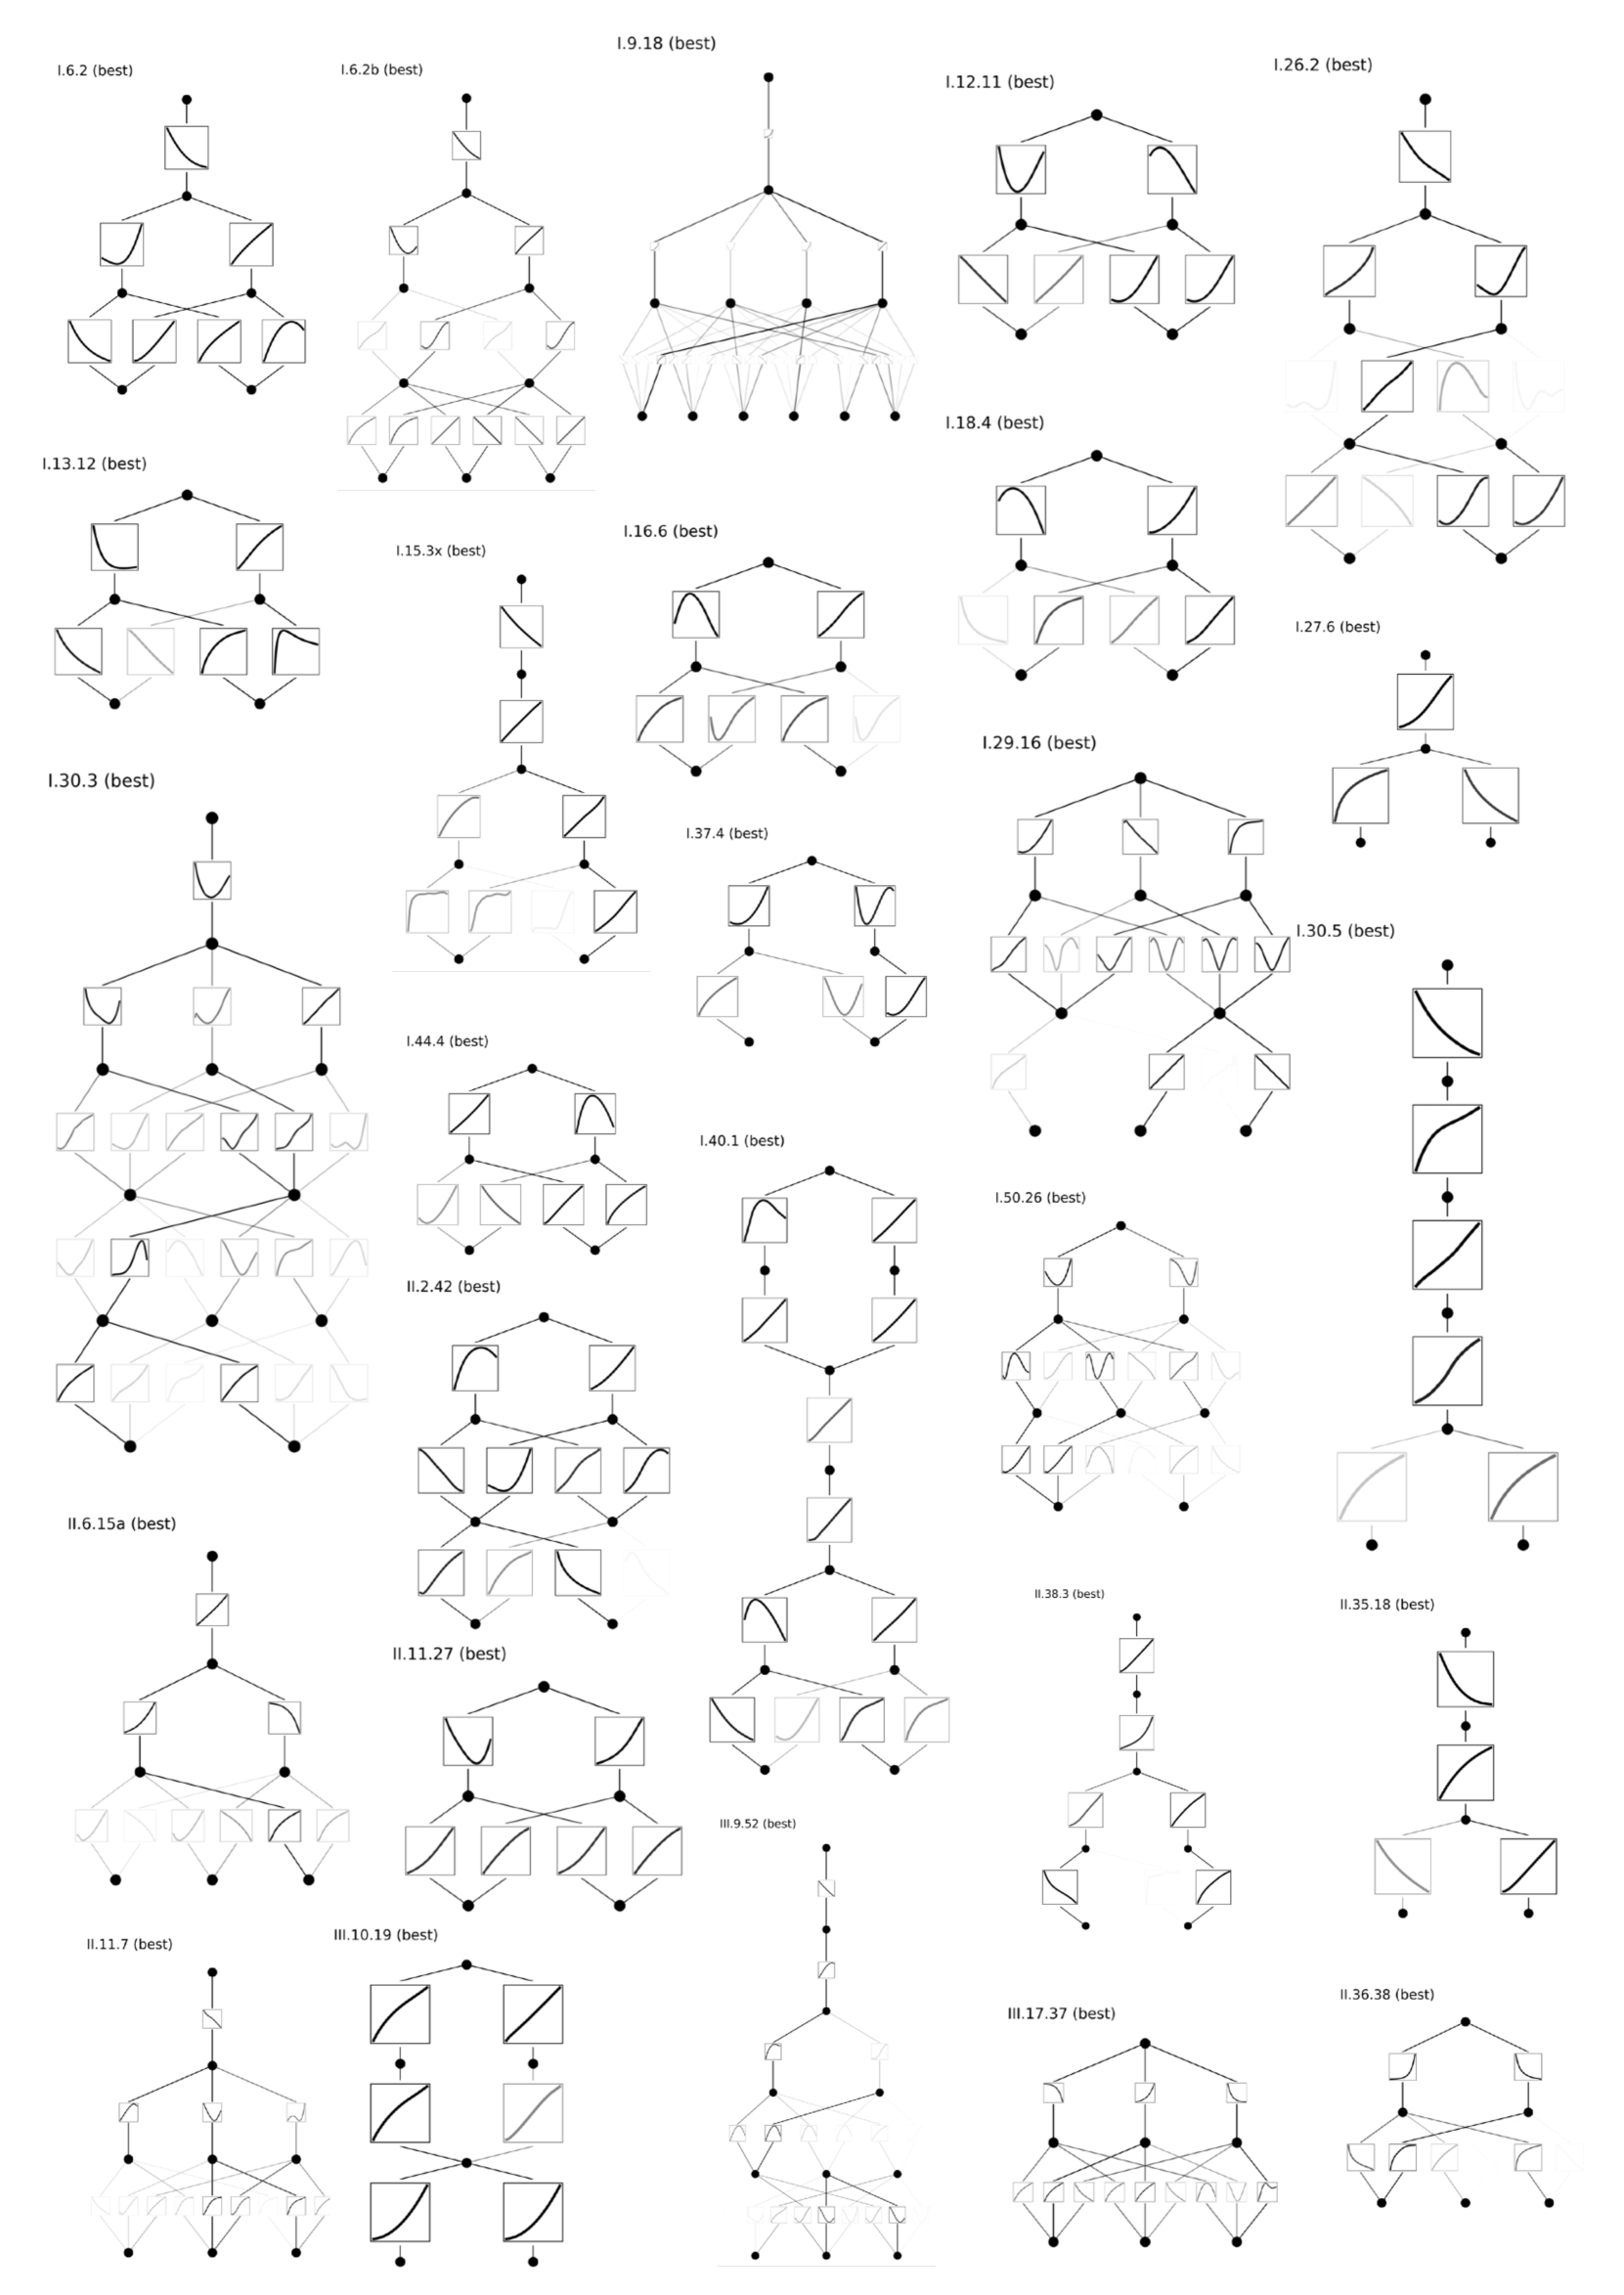
The image contains a 5x5 grid of flowchart diagrams, each labeled with a unique identifier in the format:
- **I.x.x (best)** for primary diagrams
- **II.x.x (best)** for secondary diagrams
- **III.x.x (best)** for tertiary diagrams
Each diagram consists of:
- Nodes (squares, circles, and diamonds)
- Directed arrows indicating flow
- Nested sub-diagrams within larger structures
## 2. Label Inventory
All textual labels extracted from the diagrams:
### Row 1 (Top)
1. I.6.2 (best)
2. I.6.2b (best)
3. I.9.18 (best)
4. I.12.11 (best)
5. I.26.2 (best)
### Row 2
6. I.13.12 (best)
7. I.15.3x (best)
8. I.16.6 (best)
9. I.18.4 (best)
10. I.27.6 (best)
### Row 3
11. I.30.3 (best)
12. I.44.4 (best)
13. I.37.4 (best)
14. I.30.5 (best)
15. I.50.26 (best)
### Row 4
16. II.6.15b (best)
17. II.11.27 (best)
18. II.2.42 (best)
19. II.38.3 (best)
20. II.35.18 (best)
### Row 5
21. II.11.7 (best)
22. II.10.19 (best)
23. III.17.37 (best)
24. III.36.38 (best)
## 3. Diagram Component Analysis
### Node Types
- **Squares**: Primary decision points
- **Circles**: Process steps
- **Diamonds**: Evaluation/checkpoints
- **Sub-diagrams**: Nested within larger structures
### Connection Patterns
- **Solid arrows**: Primary flow
- **Dashed arrows**: Alternative paths
- **Bidirectional arrows**: Feedback loops
## 4. Spatial Grounding
All labels positioned in the **top-left corner** of their respective diagrams. No legend or color-coding system observed in the image.
## 5. Trend Verification
No numerical data or quantitative trends present. All diagrams represent structural relationships rather than statistical information.
## 6. Component Isolation
Each diagram operates as an independent unit within the grid. No cross-diagram dependencies or shared elements identified.
## 7. Final Notes
- All text is in English
- No data tables or heatmaps present
- Diagrams appear to represent algorithmic flowcharts or process optimization models
- "(best)" suffix suggests these are optimal configurations among multiple possibilities
This structured analysis provides complete textual extraction and contextual interpretation of the flowchart diagrams for technical documentation purposes.