## Diagram: LLM Interaction Frameworks
### Overview
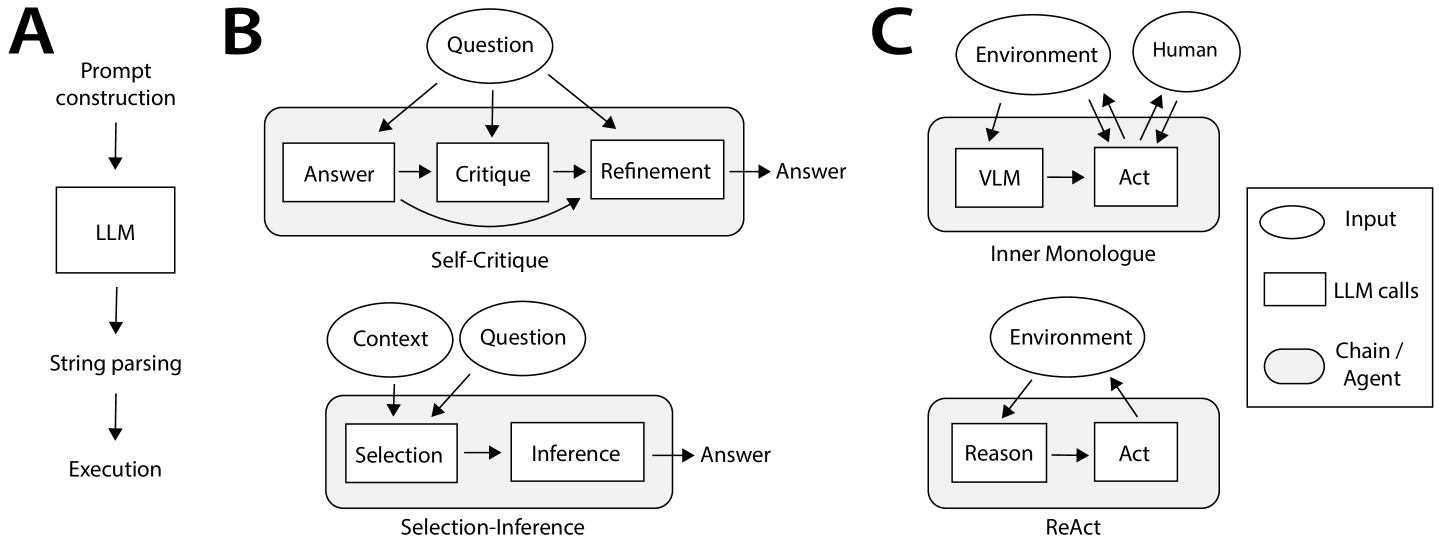
The image presents three distinct diagrams (labeled A, B, and C) illustrating different frameworks for interaction with Large Language Models (LLMs). Diagram A depicts a basic LLM workflow. Diagram B showcases two iterative refinement processes: Self-Critique and Selection-Inference. Diagram C illustrates two agent-based approaches: Inner Monologue and ReAct. A legend at the bottom-right explains the meaning of shapes and arrows.
### Components/Axes
The legend defines the following:
* **Input:** Represented by a rectangle.
* **LLM calls:** Represented by a double-lined arrow.
* **Chain / Agent:** Represented by a rectangle with rounded corners.
Diagram A labels the following components:
* Prompt construction
* LLM (Large Language Model)
* String parsing
* Execution
Diagram B labels the following components:
* Question
* Answer
* Critique
* Refinement
* Context
* Selection
* Inference
* Self-Critique
* Selection-Inference
Diagram C labels the following components:
* Environment
* Human
* VLM (Vision-Language Model)
* Act
* Reason
* Inner Monologue
* ReAct
### Detailed Analysis or Content Details
**Diagram A:**
This diagram shows a linear flow. The process begins with "Prompt construction," which feeds into the "LLM." The output of the LLM undergoes "String parsing," leading to "Execution." The flow is unidirectional, indicated by downward arrows.
**Diagram B:**
This diagram presents two parallel iterative processes.
* **Self-Critique:** A "Question" leads to an "Answer." The "Answer" is then subjected to "Critique," which informs a "Refinement" of the answer, leading back to another "Answer." This forms a loop.
* **Selection-Inference:** "Context" and "Question" feed into a "Selection" process, which then drives "Inference," resulting in an "Answer." This also forms a loop.
Both processes are connected by arrows indicating information flow.
**Diagram C:**
This diagram illustrates two agent-based interaction models.
* **Inner Monologue:** The "Environment" and "Human" interact with a "VLM." The VLM generates an "Act."
* **ReAct:** The "Environment" interacts with "Reason" and "Act" in a loop.
Arrows indicate bidirectional communication between the "Environment" and the agent components ("VLM," "Reason," "Act"). The "Human" provides input to the "Environment" in the Inner Monologue model.
### Key Observations
* Diagrams B and C represent more complex, iterative, and agent-based approaches compared to the simple linear flow in Diagram A.
* Diagram B highlights the importance of self-evaluation and context-aware reasoning.
* Diagram C emphasizes the role of interaction with an external "Environment" and the use of agents to perform actions.
* The use of loops in Diagrams B and C suggests a continuous refinement or adaptation process.
* The "Human" element is only present in Diagram C's "Inner Monologue" framework, suggesting a direct human-in-the-loop interaction.
### Interpretation
The diagrams collectively demonstrate a progression in LLM interaction paradigms. Diagram A represents a foundational approach, while Diagrams B and C showcase more sophisticated methods for improving LLM performance and enabling more complex tasks.
The Self-Critique and Selection-Inference frameworks (Diagram B) suggest a focus on improving the quality and relevance of LLM responses through internal evaluation and contextual awareness. The iterative loops indicate a commitment to continuous refinement.
The Inner Monologue and ReAct frameworks (Diagram C) represent a shift towards agent-based systems that can interact with external environments and perform actions. The bidirectional arrows highlight the dynamic interplay between the agent and its surroundings. The inclusion of a "Human" in the Inner Monologue framework suggests a potential for human guidance or intervention.
The diagrams, taken together, illustrate the evolving landscape of LLM interaction, moving from simple prompt-response systems to more intelligent, adaptive, and interactive agents. The choice of framework likely depends on the specific application and the desired level of complexity and autonomy. The diagrams are conceptual and do not provide quantitative data, but rather illustrate the *structure* of different approaches. They are useful for understanding the different ways LLMs can be integrated into larger systems.