## Scatter Plot: Performance Comparison of Language Models Across Datasets
### Overview
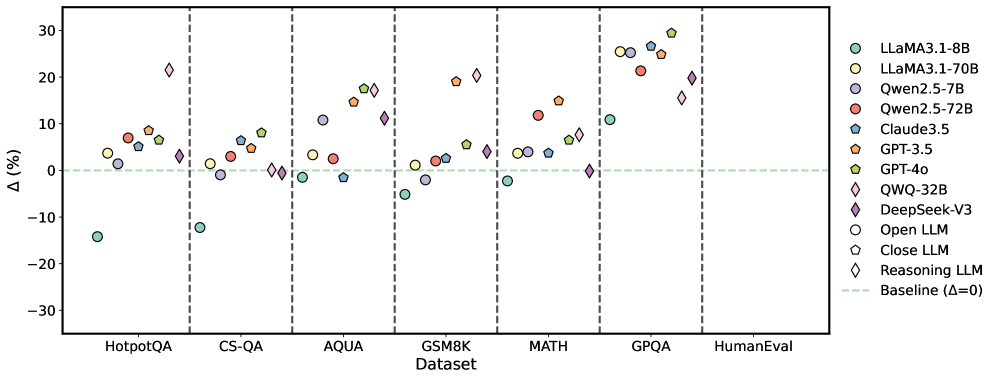
The image is a scatter plot comparing the performance of various large language models (LLMs) across multiple question-answering and reasoning datasets. The y-axis represents the percentage change (Δ%) relative to a baseline (Δ=0), while the x-axis lists datasets such as HotpotQA, CS-QA, AQUA, GSM8K, MATH, GPQA, and HumanEval. Each model is represented by a unique color and shape, with a legend on the right.
### Components/Axes
- **X-axis (Dataset)**: Categories include HotpotQA, CS-QA, AQUA, GSM8K, MATH, GPQA, and HumanEval.
- **Y-axis (Δ (%)**: Percentage change relative to a baseline (Δ=0), marked by a dashed green line.
- **Legend**: Located on the right, mapping colors and shapes to models:
- **LLaMA3.1-8B**: Cyan circles
- **LLaMA3.1-70B**: Yellow circles
- **Qwen2.5-7B**: Purple circles
- **Qwen2.5-72B**: Red circles
- **Claude3.5**: Blue pentagons
- **GPT-3.5**: Orange pentagons
- **GPT-4o**: Green pentagons
- **QWQ-32B**: Pink diamonds
- **DeepSeek-V3**: Purple diamonds
- **Open LLM**: Blue circles
- **Close LLM**: Orange pentagons
- **Reasoning LLM**: Pink diamonds
### Detailed Analysis
- **LLaMA3.1-70B (Yellow Circles)**: Consistently shows positive Δ% across most datasets, with peaks in GPQA (~25%) and HumanEval (~20%). Negative values in HotpotQA (-15%) and CS-QA (-10%).
- **Qwen2.5-72B (Red Circles)**: Moderate gains in MATH (~10%) and GPQA (~15%), with smaller values in other datasets.
- **GPT-4o (Green Pentagons)**: High positive Δ% in GPQA (~25%) and HumanEval (~20%), with smaller gains in other datasets.
- **DeepSeek-V3 (Purple Diamonds)**: Significant gains in GPQA (~20%) and HumanEval (~15%), with moderate values elsewhere.
- **OWQ-32B (Pink Diamonds)**: High gains in GPQA (~25%) and HumanEval (~20%), with smaller values in other datasets.
- **Claude3.5 (Blue Pentagons)**: Moderate gains in MATH (~10%) and GPQA (~15%), with smaller values elsewhere.
- **LLaMA3.1-8B (Cyan Circles)**: Negative Δ% in HotpotQA (-15%) and CS-QA (-10%), but positive in other datasets (e.g., MATH: ~5%, GPQA: ~10%).
- **Reasoning LLM (Pink Diamonds)**: High gains in GPQA (~25%) and HumanEval (~20%), with smaller values elsewhere.
- **Close LLM (Orange Pentagons)**: Moderate gains in MATH (~10%) and GPQA (~15%), with smaller values elsewhere.
- **Open LLM (Blue Circles)**: Negative Δ% in HotpotQA (-15%) and CS-QA (-10%), but positive in other datasets (e.g., MATH: ~5%, GPQA: ~10%).
### Key Observations
1. **Model Size Correlation**: Larger models (e.g., LLaMA3.1-70B, GPT-4o) generally show higher Δ% across datasets, though exceptions exist (e.g., LLaMA3.1-8B underperforms in HotpotQA).
2. **Dataset-Specific Performance**:
- **GPQA and HumanEval**: Most models show strong performance, with LLaMA3.1-70B, GPT-4o, and OWQ-32B leading.
- **HotpotQA and CS-QA**: Some models (e.g., LLaMA3.1-8B, Open LLM) underperform, suggesting dataset-specific challenges.
3. **Baseline Comparison**: The dashed green line (Δ=0) highlights models with negative Δ% (e.g., LLaMA3.1-8B in HotpotQA) and those exceeding the baseline.
### Interpretation
The data suggests that model size and architecture significantly influence performance, with larger models (e.g., LLaMA3.1-70B, GPT-4o) generally outperforming smaller ones. However, dataset-specific factors also play a role, as seen in the negative Δ% for LLaMA3.1-8B in HotpotQA and CS-QA. The high performance of models like DeepSeek-V3 and OWQ-32B in GPQA and HumanEval indicates specialized training or reasoning capabilities. The baseline (Δ=0) serves as a critical reference, revealing models that underperform or exceed expectations. This analysis underscores the importance of model design and training data in achieving task-specific efficiency.