TECHNICAL ASSET FINGERPRINT
2a194de2f3bf0f66f493b67c
Click to view fullscreen
Press ESC or click to close
FOUND IN PAPERS
EXPERT: healer-alpha-free VERSION 1
RUNTIME: free/openrouter/healer-alpha
INTEL_VERIFIED
## Scatter Plot: Model Performance Δ (%) Across Datasets
### Overview
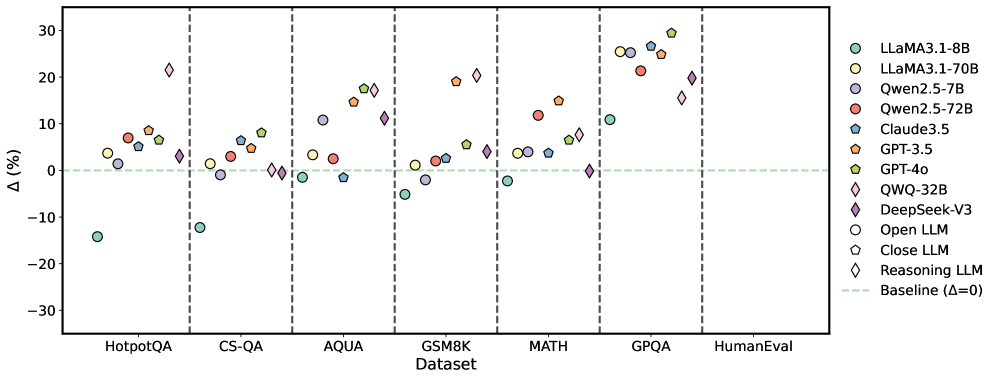
The image is a scatter plot comparing the performance change (Δ, in percentage) of various large language models (LLMs) across seven different benchmark datasets. The plot uses distinct symbols and colors to represent different model families and types (Open, Closed, Reasoning). A horizontal dashed line at Δ=0 serves as the baseline.
### Components/Axes
* **X-Axis (Categorical):** Labeled "Dataset". The categories from left to right are:
1. HotpotQA
2. CS-QA
3. AQUA
4. GSM8K
5. MATH
6. GPQA
7. HumanEval
* **Y-Axis (Numerical):** Labeled "Δ (%)". The scale ranges from -30 to 30, with major tick marks at intervals of 10 (-30, -20, -10, 0, 10, 20, 30).
* **Legend (Top-Right):** Positioned in the top-right corner of the plot area. It defines the following model symbols and colors:
* **LLaMA3.1-8B:** Teal circle (○)
* **LLaMA3.1-70B:** Light green circle (○)
* **Qwen2.5-7B:** Purple circle (○)
* **Qwen2.5-72B:** Red circle (○)
* **Claude3.5:** Blue circle (○)
* **GPT-3.5:** Orange pentagon (⬠)
* **GPT-4o:** Green pentagon (⬠)
* **QWQ-32B:** Pink diamond (◇)
* **DeepSeek-V3:** Purple diamond (◇)
* **Open LLM:** Circle symbol (○) - *This is a category marker, not a specific model.*
* **Close LLM:** Pentagon symbol (⬠) - *This is a category marker, not a specific model.*
* **Reasoning LLM:** Diamond symbol (◇) - *This is a category marker, not a specific model.*
* **Baseline:** A horizontal, light green dashed line at Δ=0, labeled "Baseline (Δ=0)" in the legend.
### Detailed Analysis
Data points are plotted for each model within each dataset column. Approximate Δ (%) values are extracted below, grouped by dataset.
**1. HotpotQA**
* **Trend:** Most models show positive Δ, clustered between 0% and 10%. One significant outlier is below -10%.
* **Data Points (Approximate):**
* LLaMA3.1-8B (Teal ○): ~ -14%
* LLaMA3.1-70B (Light Green ○): ~ +4%
* Qwen2.5-7B (Purple ○): ~ +1%
* Qwen2.5-72B (Red ○): ~ +7%
* Claude3.5 (Blue ○): ~ +6%
* GPT-3.5 (Orange ⬠): ~ +8%
* GPT-4o (Green ⬠): ~ +6%
* QWQ-32B (Pink ◇): ~ +22%
**2. CS-QA**
* **Trend:** Models are tightly clustered near the baseline, with most between -5% and +10%. One model is a clear outlier below -10%.
* **Data Points (Approximate):**
* LLaMA3.1-8B (Teal ○): ~ -12%
* LLaMA3.1-70B (Light Green ○): ~ +1%
* Qwen2.5-7B (Purple ○): ~ -2%
* Qwen2.5-72B (Red ○): ~ +3%
* Claude3.5 (Blue ○): ~ +6%
* GPT-3.5 (Orange ⬠): ~ +5%
* GPT-4o (Green ⬠): ~ +8%
* DeepSeek-V3 (Purple ◇): ~ 0%
* QWQ-32B (Pink ◇): ~ 0%
**3. AQUA**
* **Trend:** A wider spread of performance. Several models show strong positive gains (10-20%), while others are near or slightly below baseline.
* **Data Points (Approximate):**
* LLaMA3.1-8B (Teal ○): ~ -1%
* LLaMA3.1-70B (Light Green ○): ~ +4%
* Qwen2.5-7B (Purple ○): ~ +11%
* Qwen2.5-72B (Red ○): ~ +3%
* Claude3.5 (Blue ○): ~ -1%
* GPT-3.5 (Orange ⬠): ~ +15%
* GPT-4o (Green ⬠): ~ +18%
* DeepSeek-V3 (Purple ◇): ~ +11%
* QWQ-32B (Pink ◇): ~ +17%
**4. GSM8K**
* **Trend:** Mixed results. Some models show strong positive Δ (~20%), while others are negative or near zero.
* **Data Points (Approximate):**
* LLaMA3.1-8B (Teal ○): ~ -5%
* LLaMA3.1-70B (Light Green ○): ~ +1%
* Qwen2.5-7B (Purple ○): ~ -2%
* Qwen2.5-72B (Red ○): ~ +2%
* Claude3.5 (Blue ○): ~ +3%
* GPT-3.5 (Orange ⬠): ~ +19%
* GPT-4o (Green ⬠): ~ +5%
* DeepSeek-V3 (Purple ◇): ~ +4%
* QWQ-32B (Pink ◇): ~ +20%
**5. MATH**
* **Trend:** Generally positive performance, with most models between 0% and +15%. One model is at the baseline.
* **Data Points (Approximate):**
* LLaMA3.1-8B (Teal ○): ~ -2%
* LLaMA3.1-70B (Light Green ○): ~ +4%
* Qwen2.5-7B (Purple ○): ~ +4%
* Qwen2.5-72B (Red ○): ~ +12%
* Claude3.5 (Blue ○): ~ +6%
* GPT-3.5 (Orange ⬠): ~ +15%
* GPT-4o (Green ⬠): ~ +7%
* DeepSeek-V3 (Purple ◇): ~ 0%
* QWQ-32B (Pink ◇): ~ +8%
**6. GPQA**
* **Trend:** This dataset shows the highest and most consistently positive Δ values across nearly all models, with a cluster between +20% and +30%.
* **Data Points (Approximate):**
* LLaMA3.1-8B (Teal ○): ~ +11%
* LLaMA3.1-70B (Light Green ○): ~ +25%
* Qwen2.5-7B (Purple ○): ~ +26%
* Qwen2.5-72B (Red ○): ~ +21%
* Claude3.5 (Blue ○): ~ +27%
* GPT-3.5 (Orange ⬠): ~ +25%
* GPT-4o (Green ⬠): ~ +30%
* DeepSeek-V3 (Purple ◇): ~ +15%
* QWQ-32B (Pink ◇): ~ +20%
**7. HumanEval**
* **Trend:** Only two data points are visible, both showing positive Δ.
* **Data Points (Approximate):**
* GPT-4o (Green ⬠): ~ +20%
* QWQ-32B (Pink ◇): ~ +19%
### Key Observations
1. **Dataset Difficulty:** GPQA elicits the largest positive performance changes (Δ) across the board, suggesting it may be a benchmark where recent model improvements are most pronounced. Conversely, HotpotQA and CS-QA show more modest or even negative changes for some models.
2. **Model Performance:** GPT-4o (Green ⬠) and QWQ-32B (Pink ◇) are frequently among the top performers, often showing Δ > +15%. LLaMA3.1-8B (Teal ○) is the most consistent negative outlier, showing negative Δ in 5 out of 6 datasets where it appears.
3. **Model Type Trends:** "Reasoning LLMs" (Diamonds: QWQ-32B, DeepSeek-V3) generally show strong positive Δ, particularly on AQUA, GSM8K, and GPQA. "Closed LLMs" (Pentagons: GPT-3.5, GPT-4o) also show strong positive trends, especially on GPQA.
4. **Outliers:** The most significant negative outlier is LLaMA3.1-8B on HotpotQA (~ -14%). The most significant positive outlier is GPT-4o on GPQA (~ +30%).
### Interpretation
This chart visualizes the **relative improvement or degradation (Δ)** of various LLMs compared to a baseline (likely a previous model version or a standard prompting method) across diverse reasoning and knowledge benchmarks.
* **What the data suggests:** The positive Δ values for most models on most datasets indicate that the evaluated models generally outperform the baseline. The magnitude of improvement is highly dataset-dependent, with complex reasoning tasks (GPQA, MATH) showing larger gains than others (CS-QA).
* **Relationships:** The plot allows for a direct comparison of model families (e.g., LLaMA vs. Qwen vs. GPT) and types (Open vs. Closed vs. Reasoning) on the same tasks. It highlights that model size alone (e.g., LLaMA3.1-70B vs. 8B) is not the sole determinant of performance gain, as architecture and training (implied by model family) play a crucial role.
* **Anomalies & Insights:** The consistently negative Δ for LLaMA3.1-8B suggests it may be a weaker baseline or that the specific evaluation setup disadvantaged it. The exceptional performance of all models on GPQA is notable and may warrant investigation into the nature of that benchmark—whether it aligns particularly well with current model capabilities or training data. The absence of data for many models on HumanEval limits conclusions for that specific coding task.
DECODING INTELLIGENCE...