## Histogram: Reward Score Distribution Comparison
### Overview
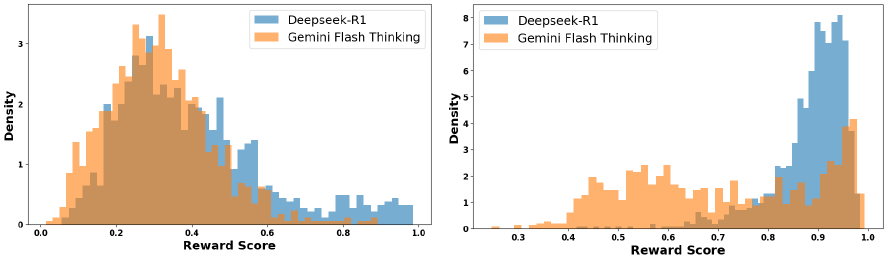
The image contains two histograms comparing the distribution of reward scores for two different models: Deepseek-R1 and Gemini Flash Thinking. The histograms display the density of reward scores on the y-axis and the reward score itself on the x-axis. The left histogram shows a distribution with lower reward scores, while the right histogram shows a distribution with higher reward scores.
### Components/Axes
* **X-axis (Reward Score):** Ranges from 0.0 to 1.0 in both histograms.
* **Y-axis (Density):** Represents the frequency or density of reward scores. The left histogram ranges from 0 to approximately 3.5, while the right histogram ranges from 0 to approximately 8.
* **Legend (Top-Left):**
* **Deepseek-R1:** Represented by a light blue color.
* **Gemini Flash Thinking:** Represented by a light orange color.
### Detailed Analysis
**Left Histogram:**
* **Deepseek-R1 (Light Blue):** The distribution is skewed to the right, with a peak around 0.4. The density starts around 0 at 0.0, rises to a peak around 0.4, and then gradually decreases towards 1.0.
* **Gemini Flash Thinking (Light Orange):** The distribution is skewed to the right, with a peak around 0.2. The density starts around 0 at 0.0, rises to a peak around 0.2, and then gradually decreases towards 1.0.
**Right Histogram:**
* **Deepseek-R1 (Light Blue):** The distribution is heavily skewed to the left, with a peak near 0.9. The density is low until around 0.7, then rises sharply to a peak near 0.9, and then decreases towards 1.0.
* **Gemini Flash Thinking (Light Orange):** The distribution is more spread out compared to Deepseek-R1, with a peak around 0.6. The density starts around 0 at 0.3, rises to a peak around 0.6, and then gradually decreases towards 1.0.
### Key Observations
* In the left histogram, Gemini Flash Thinking has a higher density at lower reward scores (around 0.2) compared to Deepseek-R1.
* In the right histogram, Deepseek-R1 has a significantly higher density at higher reward scores (around 0.9) compared to Gemini Flash Thinking.
* The distributions of reward scores are different for the two models, suggesting different performance characteristics.
### Interpretation
The histograms suggest that Deepseek-R1 and Gemini Flash Thinking have different reward score distributions. The left histogram indicates that Gemini Flash Thinking tends to achieve lower reward scores more frequently than Deepseek-R1. Conversely, the right histogram indicates that Deepseek-R1 tends to achieve higher reward scores more frequently than Gemini Flash Thinking. This suggests that Deepseek-R1 may be performing better in scenarios represented by the right histogram, while Gemini Flash Thinking may be performing better in scenarios represented by the left histogram. The difference in performance could be due to the models' architectures, training data, or other factors. It is important to note that these are just distributions, and the actual performance of the models may vary depending on the specific task.