\n
## Histograms: Reward Score Distribution for Deepseek-R1 and Gemini Flash Thinking
### Overview
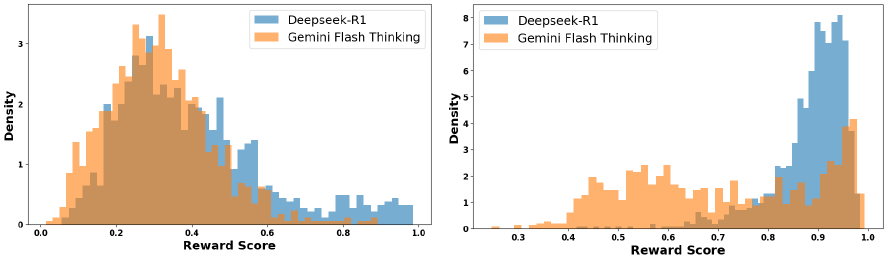
The image presents two histograms, side-by-side, comparing the distribution of "Reward Scores" for two models: Deepseek-R1 and Gemini Flash Thinking. Both histograms use the same x-axis scale (Reward Score from 0.0 to 1.0) and y-axis scale (Density from 0.0 to approximately 8.0). The histograms are overlaid, allowing for a visual comparison of the score distributions.
### Components/Axes
* **X-axis:** "Reward Score" ranging from 0.0 to 1.0.
* **Y-axis:** "Density" ranging from 0.0 to approximately 8.0.
* **Legend:** Located in the top-left corner of each histogram.
* Deepseek-R1: Represented by a light blue color.
* Gemini Flash Thinking: Represented by a light orange color.
### Detailed Analysis or Content Details
**Histogram 1 (Left):**
* **Deepseek-R1 (Light Blue):** The distribution appears to be unimodal, peaking around a Reward Score of 0.7. The density at the peak is approximately 1.5. The distribution extends from approximately 0.1 to 1.0, with a significant drop-off in density below 0.2 and above 0.8.
* **Gemini Flash Thinking (Light Orange):** This distribution is also unimodal, but peaks at a lower Reward Score, around 0.2. The peak density is approximately 3.0. The distribution is wider than Deepseek-R1, extending from approximately 0.0 to 0.6, with a rapid decline in density above 0.4.
**Histogram 2 (Right):**
* **Deepseek-R1 (Light Blue):** This distribution is strongly skewed to the right, with a large peak at a Reward Score of approximately 0.95. The peak density is approximately 7.5. The distribution has a long tail extending towards 1.0.
* **Gemini Flash Thinking (Light Orange):** The distribution is unimodal, peaking around a Reward Score of 0.5. The peak density is approximately 2.5. The distribution extends from approximately 0.2 to 0.8, with a gradual decline in density towards the extremes.
### Key Observations
* In the first histogram, Gemini Flash Thinking has a higher density of scores in the lower range (0.0-0.4) compared to Deepseek-R1. Deepseek-R1 has a higher density of scores in the higher range (0.6-1.0).
* In the second histogram, Deepseek-R1 exhibits a strong preference for high Reward Scores (close to 1.0), while Gemini Flash Thinking's distribution is more centered around 0.5.
* The distributions are significantly different in both histograms, suggesting that the two models have different reward-seeking behaviors.
### Interpretation
The data suggests that Deepseek-R1 and Gemini Flash Thinking have fundamentally different approaches to the task being evaluated. The first histogram indicates that Gemini Flash Thinking tends to produce results with lower reward scores, while Deepseek-R1 produces results with higher reward scores. The second histogram shows a more extreme difference, with Deepseek-R1 heavily favoring high reward scores, potentially indicating a more optimized or successful strategy.
The difference in distributions could be due to several factors, including:
* **Different training data:** The models may have been trained on different datasets, leading to different biases.
* **Different model architectures:** The underlying architectures of the models may influence their ability to achieve high reward scores.
* **Different reward functions:** The reward function used to evaluate the models may favor different types of outputs.
The presence of distinct peaks and shapes in the histograms suggests that the reward scores are not randomly distributed, and that there are underlying patterns in the models' behavior. The strong skew in the second histogram for Deepseek-R1 is particularly noteworthy, as it indicates a high degree of confidence in its ability to achieve high reward scores.