## Chart: Confidence vs. Target Length for Public Relations
### Overview
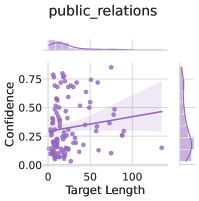
The image presents a scatter plot showing the relationship between "Confidence" and "Target Length" for the category "public_relations". The plot includes a regression line with a confidence interval, as well as marginal distributions for each variable.
### Components/Axes
* **Title:** public\_relations
* **X-axis:** Target Length
* Scale: 0 to approximately 120
* **Y-axis:** Confidence
* Scale: 0.00 to 0.75
* **Data Points:** Each point represents a data entry, colored in purple.
* **Regression Line:** A purple line indicating the linear relationship between Target Length and Confidence, surrounded by a shaded purple area representing the confidence interval.
* **Marginal Distributions:** Histograms and kernel density estimates are shown along the top (for Target Length) and right side (for Confidence).
### Detailed Analysis
* **Target Length:**
* Ranges from approximately 0 to 120.
* The marginal distribution shows a concentration of data points at lower values, with a long tail extending to higher values.
* **Confidence:**
* Ranges from 0.00 to 0.75.
* The marginal distribution shows a peak around 0.25, with a spread of values across the range.
* **Scatter Plot:**
* The data points are scattered, with a higher density at lower Target Length values.
* The regression line has a slight positive slope, suggesting a weak positive correlation between Target Length and Confidence.
* **Regression Line:**
* The regression line starts at approximately 0.30 Confidence at Target Length 0.
* The regression line ends at approximately 0.45 Confidence at Target Length 120.
### Key Observations
* There is a weak positive correlation between Target Length and Confidence.
* Most data points are clustered at lower Target Length values.
* The confidence interval around the regression line is relatively wide, indicating uncertainty in the relationship.
### Interpretation
The scatter plot suggests that, for the "public\_relations" category, there is a slight tendency for Confidence to increase as Target Length increases. However, the relationship is weak, and there is considerable variability in the data. The concentration of data points at lower Target Length values suggests that shorter targets are more common in this category. The wide confidence interval indicates that the observed relationship may not be statistically significant.