## Scatter Plot: public_relations
### Overview
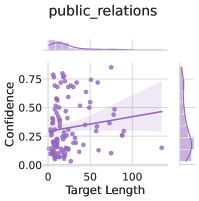
The image is a scatter plot titled "public_relations" showing the relationship between "Target Length" (x-axis) and "Confidence" (y-axis). A trend line with a shaded confidence interval is overlaid on the data points. The plot includes a legend in the top-left corner and grid lines for reference.
### Components/Axes
- **Title**: "public_relations" (top center)
- **X-axis**: "Target Length" (0 to 100, with ticks at 0, 50, 100)
- **Y-axis**: "Confidence" (0.00 to 0.75, with ticks at 0.25, 0.50, 0.75)
- **Legend**: Located in the top-left corner, labeled "Confidence Interval" with a shaded area.
- **Data Points**: Purple dots scattered across the plot.
- **Trend Line**: A dark purple line with a positive slope, indicating a relationship between Target Length and Confidence.
- **Shaded Area**: A lighter purple region above the trend line, representing the confidence interval.
### Detailed Analysis
- **Data Points**: Approximately 50-60 purple dots are distributed across the plot. Most points cluster near the trend line, with some variability.
- **Trend Line**: The line starts near (0, 0.25) and ends near (100, 0.75), suggesting a linear increase in Confidence with Target Length. The slope is approximately 0.005 per unit of Target Length (calculated as (0.75 - 0.25)/100).
- **Confidence Interval**: The shaded area above the trend line indicates the upper bound of the confidence interval. The width of the shaded region suggests a 95% confidence interval (common default, though not explicitly stated).
- **Legend**: The legend is positioned in the top-left corner, with the "Confidence Interval" label and shaded area matching the plot's visual elements.
### Key Observations
- **Positive Correlation**: The trend line shows a clear upward slope, indicating that higher Target Lengths are associated with higher Confidence levels.
- **Data Variability**: While most points align with the trend line, there is noticeable scatter, suggesting some outliers or noise in the data.
- **Confidence Interval**: The shaded area above the trend line implies uncertainty in the relationship, with the interval widening as Target Length increases.
### Interpretation
The data suggests a positive relationship between Target Length and Confidence in the context of public relations. As Target Length increases, Confidence tends to rise, with the trend line indicating a linear relationship. The shaded confidence interval highlights the uncertainty around this relationship, suggesting that while the general trend is upward, individual data points may vary. The legend's placement and color coding ensure clarity, but the absence of explicit confidence level (e.g., 95%) leaves room for interpretation. The plot emphasizes the importance of Target Length in influencing Confidence, though the variability in data points underscores the need for further analysis to account for outliers or external factors.