\n
## Charts: Validation Loss and COCO Caption Performance
### Overview
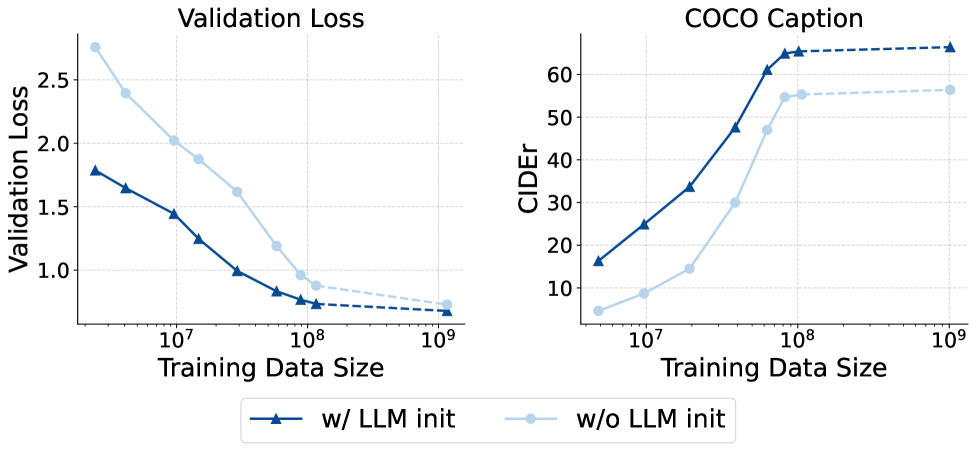
The image presents two line charts side-by-side. The left chart displays "Validation Loss" against "Training Data Size". The right chart shows "COCO Caption" performance, measured by "CIDEr" score, also against "Training Data Size". Both charts compare two conditions: with LLM initialization ("w/ LLM init") and without LLM initialization ("w/o LLM init"). The x-axis for both charts is logarithmic.
### Components/Axes
* **Left Chart:**
* Title: "Validation Loss"
* X-axis: "Training Data Size" (Logarithmic scale, ranging approximately from 10<sup>7</sup> to 10<sup>9</sup>)
* Y-axis: "Validation Loss" (Linear scale, ranging from 0 to 2.5)
* **Right Chart:**
* Title: "COCO Caption"
* X-axis: "Training Data Size" (Logarithmic scale, ranging approximately from 10<sup>7</sup> to 10<sup>9</sup>)
* Y-axis: "CIDEr" (Linear scale, ranging from 0 to 60)
* **Legend (Bottom-Center):**
* "w/ LLM init" - Dark Blue, represented by a solid line with triangle markers.
* "w/o LLM init" - Light Blue, represented by a dashed line with circle markers.
### Detailed Analysis or Content Details
**Left Chart (Validation Loss):**
* **w/ LLM init (Dark Blue):** The line starts at approximately 1.7 at 10<sup>7</sup>, decreases to around 0.8 at 10<sup>8</sup>, and then plateaus around 0.6-0.7 for data sizes greater than 10<sup>8</sup>.
* **w/o LLM init (Light Blue):** The line begins at approximately 2.3 at 10<sup>7</sup>, decreases to around 1.0 at 10<sup>8</sup>, and then continues to decrease, reaching approximately 0.8 at 10<sup>9</sup>.
**Right Chart (COCO Caption - CIDEr):**
* **w/ LLM init (Dark Blue):** The line starts at approximately 25 at 10<sup>7</sup>, increases sharply to around 62 at 10<sup>8</sup>, and then plateaus around 60-63 for data sizes greater than 10<sup>8</sup>.
* **w/o LLM init (Light Blue):** The line begins at approximately 8 at 10<sup>7</sup>, increases to around 55 at 10<sup>8</sup>, and then continues to increase, reaching approximately 58 at 10<sup>9</sup>.
### Key Observations
* **Validation Loss:** LLM initialization consistently results in lower validation loss across all training data sizes. The benefit of LLM initialization is most pronounced between 10<sup>7</sup> and 10<sup>8</sup> training data size.
* **COCO Caption (CIDEr):** LLM initialization significantly improves CIDEr scores, especially as the training data size increases. The performance gap between the two conditions widens with larger datasets.
* **Plateaus:** Both metrics show a tendency to plateau after a certain training data size (around 10<sup>8</sup> for Validation Loss and 10<sup>8</sup> for CIDEr).
### Interpretation
The data strongly suggests that initializing the model with a Large Language Model (LLM) significantly improves both validation performance (lower loss) and captioning quality (higher CIDEr score). The benefits of LLM initialization are particularly evident with larger training datasets. The plateaus observed in both charts indicate diminishing returns from increasing the training data size beyond a certain point. This could be due to the model reaching its capacity or the data becoming redundant. The consistent performance advantage of LLM initialization suggests that the pre-trained knowledge embedded in the LLM is effectively transferred to the captioning task, leading to better generalization and performance. The logarithmic scale on the x-axis highlights the rapid gains achieved with relatively small increases in training data size, particularly in the early stages of training.