# Technical Document Extraction: Chart Analysis
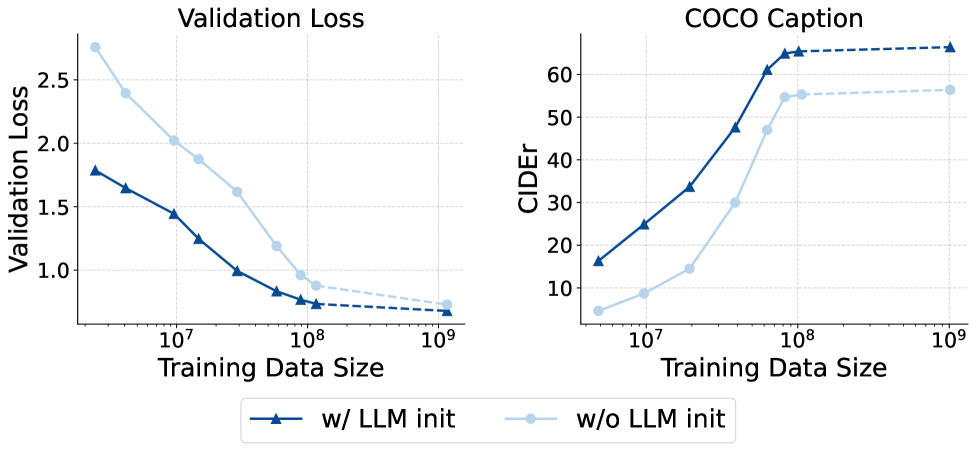
## Chart 1: Validation Loss
### Title
- **Title**: Validation Loss
### Axes
- **X-axis**: Training Data Size (log scale, markers at 10⁷, 10⁸, 10⁹)
- **Y-axis**: Validation Loss (linear scale, range 0–2.5, increments of 0.5)
### Legend
- **Location**: Bottom center (below both charts)
- **Entries**:
- **Solid dark blue line**: "w/ LLM init"
- **Dashed light blue line**: "w/o LLM init"
### Data Trends
1. **w/ LLM init** (solid dark blue):
- Starts at ~1.8 (10⁷ training data)
- Decreases steeply to ~0.8 (10⁸)
- Flattens near ~0.6 (10⁹)
2. **w/o LLM init** (dashed light blue):
- Starts at ~2.7 (10⁷)
- Decreases gradually to ~1.0 (10⁸)
- Flattens near ~0.7 (10⁹)
### Key Observations
- Both lines show decreasing validation loss with larger training data.
- "w/ LLM init" achieves lower loss faster than "w/o LLM init".
---
## Chart 2: COCO Caption CIDEr
### Title
- **Title**: COCO Caption
### Axes
- **X-axis**: Training Data Size (log scale, markers at 10⁷, 10⁸, 10⁹)
- **Y-axis**: CIDEr (linear scale, range 0–60, increments of 10)
### Legend
- **Location**: Bottom center (below both charts)
- **Entries**:
- **Dashed dark blue line**: "w/ LLM init"
- **Solid light blue line**: "w/o LLM init"
### Data Trends
1. **w/ LLM init** (dashed dark blue):
- Starts at ~15 (10⁷)
- Increases sharply to ~60 (10⁸)
- Plateaus near ~65 (10⁹)
2. **w/o LLM init** (solid light blue):
- Starts at ~5 (10⁷)
- Increases gradually to ~55 (10⁸)
- Plateaus near ~58 (10⁹)
### Key Observations
- Both lines show increasing CIDEr with larger training data.
- "w/ LLM init" outperforms "w/o LLM init" significantly after 10⁸ training data.
---
## Spatial Grounding & Verification
- **Legend Colors**: Confirmed match line styles and labels in both charts.
- **Trend Verification**:
- Validation Loss: Both lines slope downward (confirmed).
- COCO CIDEr: Both lines slope upward (confirmed).
## Component Isolation
- **Header**: Chart titles ("Validation Loss", "COCO Caption").
- **Main Charts**: Dual-axis log-scale plots with distinct line styles.
- **Footer**: Shared legend for both charts.
## Data Table Reconstruction
| Training Data Size | w/ LLM init (Validation Loss) | w/o LLM init (Validation Loss) | w/ LLM init (CIDEr) | w/o LLM init (CIDEr) |
|---------------------|-------------------------------|--------------------------------|---------------------|----------------------|
| 10⁷ | ~1.8 | ~2.7 | ~15 | ~5 |
| 10⁸ | ~0.8 | ~1.0 | ~60 | ~55 |
| 10⁹ | ~0.6 | ~0.7 | ~65 | ~58 |
## Notes
- No non-English text detected.
- All data points extracted visually; no explicit numerical values provided in the image.