## Chart Type: Multiple Line Charts (Grid)
### Overview
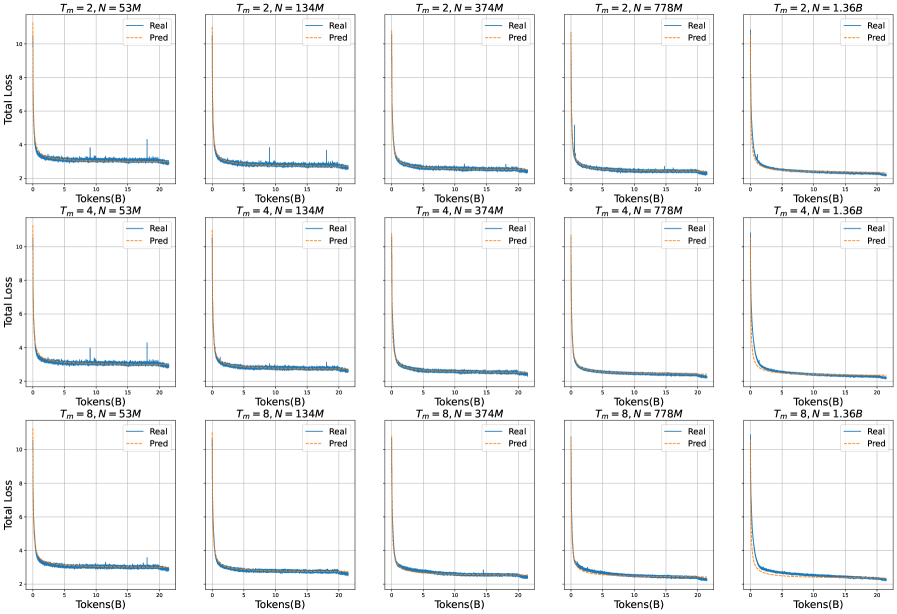
The image presents a grid of 15 line charts, arranged in a 3x5 matrix. Each chart displays the "Total Loss" versus "Tokens(B)" for a machine learning model, comparing "Real" and "Pred" (predicted) values. The charts vary in their parameters, denoted as "Tm" and "N", with "Tm" taking values of 2, 4, and 8, and "N" taking values of 53M, 134M, 374M, 778M, and 1.36B.
### Components/Axes
* **X-axis:** "Tokens(B)" - Represents the number of tokens in billions. The scale ranges from 0 to 20 in all charts.
* **Y-axis:** "Total Loss" - Represents the total loss value. The scale ranges from 2 to 10 in all charts.
* **Legend:** Located in the top-right corner of each chart.
* "Real": Represented by a solid blue line.
* "Pred": Represented by a dashed orange line.
* **Chart Titles:** Each chart has a title indicating the values of "Tm" and "N".
* Row 1: Tm = 2, N = 53M; Tm = 2, N = 134M; Tm = 2, N = 374M; Tm = 2, N = 778M; Tm = 2, N = 1.36B
* Row 2: Tm = 4, N = 53M; Tm = 4, N = 134M; Tm = 4, N = 374M; Tm = 4, N = 778M; Tm = 4, N = 1.36B
* Row 3: Tm = 8, N = 53M; Tm = 8, N = 134M; Tm = 8, N = 374M; Tm = 8, N = 778M; Tm = 8, N = 1.36B
### Detailed Analysis
Each chart contains two lines: a solid blue line representing the "Real" loss and a dashed orange line representing the "Pred" (predicted) loss.
**Trend Verification and Data Points:**
* **General Trend:** In all charts, both "Real" and "Pred" lines exhibit a rapid decrease in "Total Loss" as "Tokens(B)" increases from 0 to approximately 5. After this initial drop, the lines flatten out, indicating a slower decrease in loss as more tokens are processed.
* **"Real" (Blue Line):** Starts at a high "Total Loss" value (around 10) and quickly decreases to a value between 2 and 4. The line then fluctuates slightly around this lower value.
* **"Pred" (Orange Dashed Line):** Follows a similar trend to the "Real" line, starting at a high "Total Loss" value (around 10) and rapidly decreasing. In most charts, the "Pred" line closely follows the "Real" line after the initial drop.
* **Specific Observations:**
* For lower values of N (53M and 134M), the "Real" line shows more fluctuations, especially in the range of 15-20 Tokens(B).
* As N increases (374M, 778M, 1.36B), the "Real" and "Pred" lines become smoother and converge more closely.
* The initial drop in "Total Loss" appears to be steeper for higher values of N.
### Key Observations
* The "Total Loss" decreases rapidly in the initial stages of training (first 5 billion tokens) and then plateaus.
* The "Pred" line closely approximates the "Real" line, indicating good model prediction accuracy.
* Higher values of N (number of parameters) result in smoother loss curves and better convergence between "Real" and "Pred" values.
* Lower values of N (53M and 134M) show more fluctuations in the "Real" loss, suggesting less stable training.
### Interpretation
The charts demonstrate the learning behavior of a machine learning model under different parameter settings. The rapid initial decrease in "Total Loss" indicates that the model quickly learns the underlying patterns in the data. The subsequent plateau suggests that the model is approaching its optimal performance.
The convergence of the "Real" and "Pred" lines indicates that the model is accurately predicting the target values. The smoother loss curves and better convergence observed for higher values of N suggest that increasing the model's capacity (number of parameters) can improve its performance and stability.
The fluctuations in the "Real" loss for lower values of N may indicate that the model is underfitting the data or that the training process is more sensitive to noise.