## Bar Charts: Robustness to Many-to-One SCM: BELM vs. DDIM
### Overview
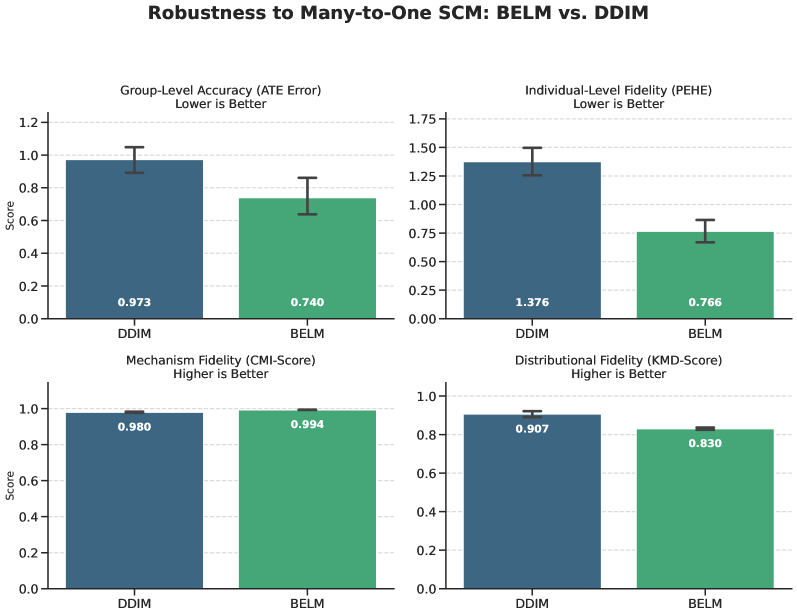
The image presents four bar charts comparing the performance of two methods, BELM and DDIM, in terms of robustness to Many-to-One Structural Causal Models (SCM). The charts evaluate Group-Level Accuracy, Individual-Level Fidelity, Mechanism Fidelity, and Distributional Fidelity. Each chart displays the score for each method, along with error bars indicating variability.
### Components/Axes
* **Title:** Robustness to Many-to-One SCM: BELM vs. DDIM
* **X-axis:** Categorical, representing the two methods being compared: DDIM and BELM.
* **Y-axis:** Numerical, labeled "Score," ranging from 0.0 to 1.2 (Group-Level Accuracy), 0.00 to 1.75 (Individual-Level Fidelity), 0.0 to 1.0 (Mechanism Fidelity), and 0.0 to 1.0 (Distributional Fidelity).
* **Error Bars:** Represent variability or uncertainty in the scores for each method.
* **Chart Titles:**
* Group-Level Accuracy (ATE Error) - Lower is Better
* Individual-Level Fidelity (PEHE) - Lower is Better
* Mechanism Fidelity (CMI-Score) - Higher is Better
* Distributional Fidelity (KMD-Score) - Higher is Better
* **Bar Colors:** DDIM is represented by a dark teal color, and BELM is represented by a green color.
### Detailed Analysis
**1. Group-Level Accuracy (ATE Error) - Lower is Better**
* **Trend:** Lower scores are better. BELM has a lower score than DDIM.
* **DDIM:** Score of approximately 0.973.
* **BELM:** Score of approximately 0.740.
**2. Individual-Level Fidelity (PEHE) - Lower is Better**
* **Trend:** Lower scores are better. BELM has a lower score than DDIM.
* **DDIM:** Score of approximately 1.376.
* **BELM:** Score of approximately 0.766.
**3. Mechanism Fidelity (CMI-Score) - Higher is Better**
* **Trend:** Higher scores are better. BELM has a slightly higher score than DDIM.
* **DDIM:** Score of approximately 0.980.
* **BELM:** Score of approximately 0.994.
**4. Distributional Fidelity (KMD-Score) - Higher is Better**
* **Trend:** Higher scores are better. DDIM has a higher score than BELM.
* **DDIM:** Score of approximately 0.907.
* **BELM:** Score of approximately 0.830.
### Key Observations
* For Group-Level Accuracy and Individual-Level Fidelity, BELM outperforms DDIM, as lower scores are preferred.
* For Mechanism Fidelity, BELM slightly outperforms DDIM.
* For Distributional Fidelity, DDIM outperforms BELM.
* The error bars indicate some variability in the scores, but the differences between BELM and DDIM appear to be relatively consistent across the four metrics.
### Interpretation
The data suggests that BELM and DDIM have different strengths and weaknesses in terms of robustness to Many-to-One SCM. BELM demonstrates better Group-Level Accuracy and Individual-Level Fidelity, while DDIM shows better Distributional Fidelity. BELM also has a slightly better Mechanism Fidelity. The choice between BELM and DDIM may depend on the specific application and the relative importance of these different metrics. The error bars suggest that these results are reasonably consistent, but further analysis with larger datasets may be warranted.