## Line Chart: Accuracy vs. Step
### Overview
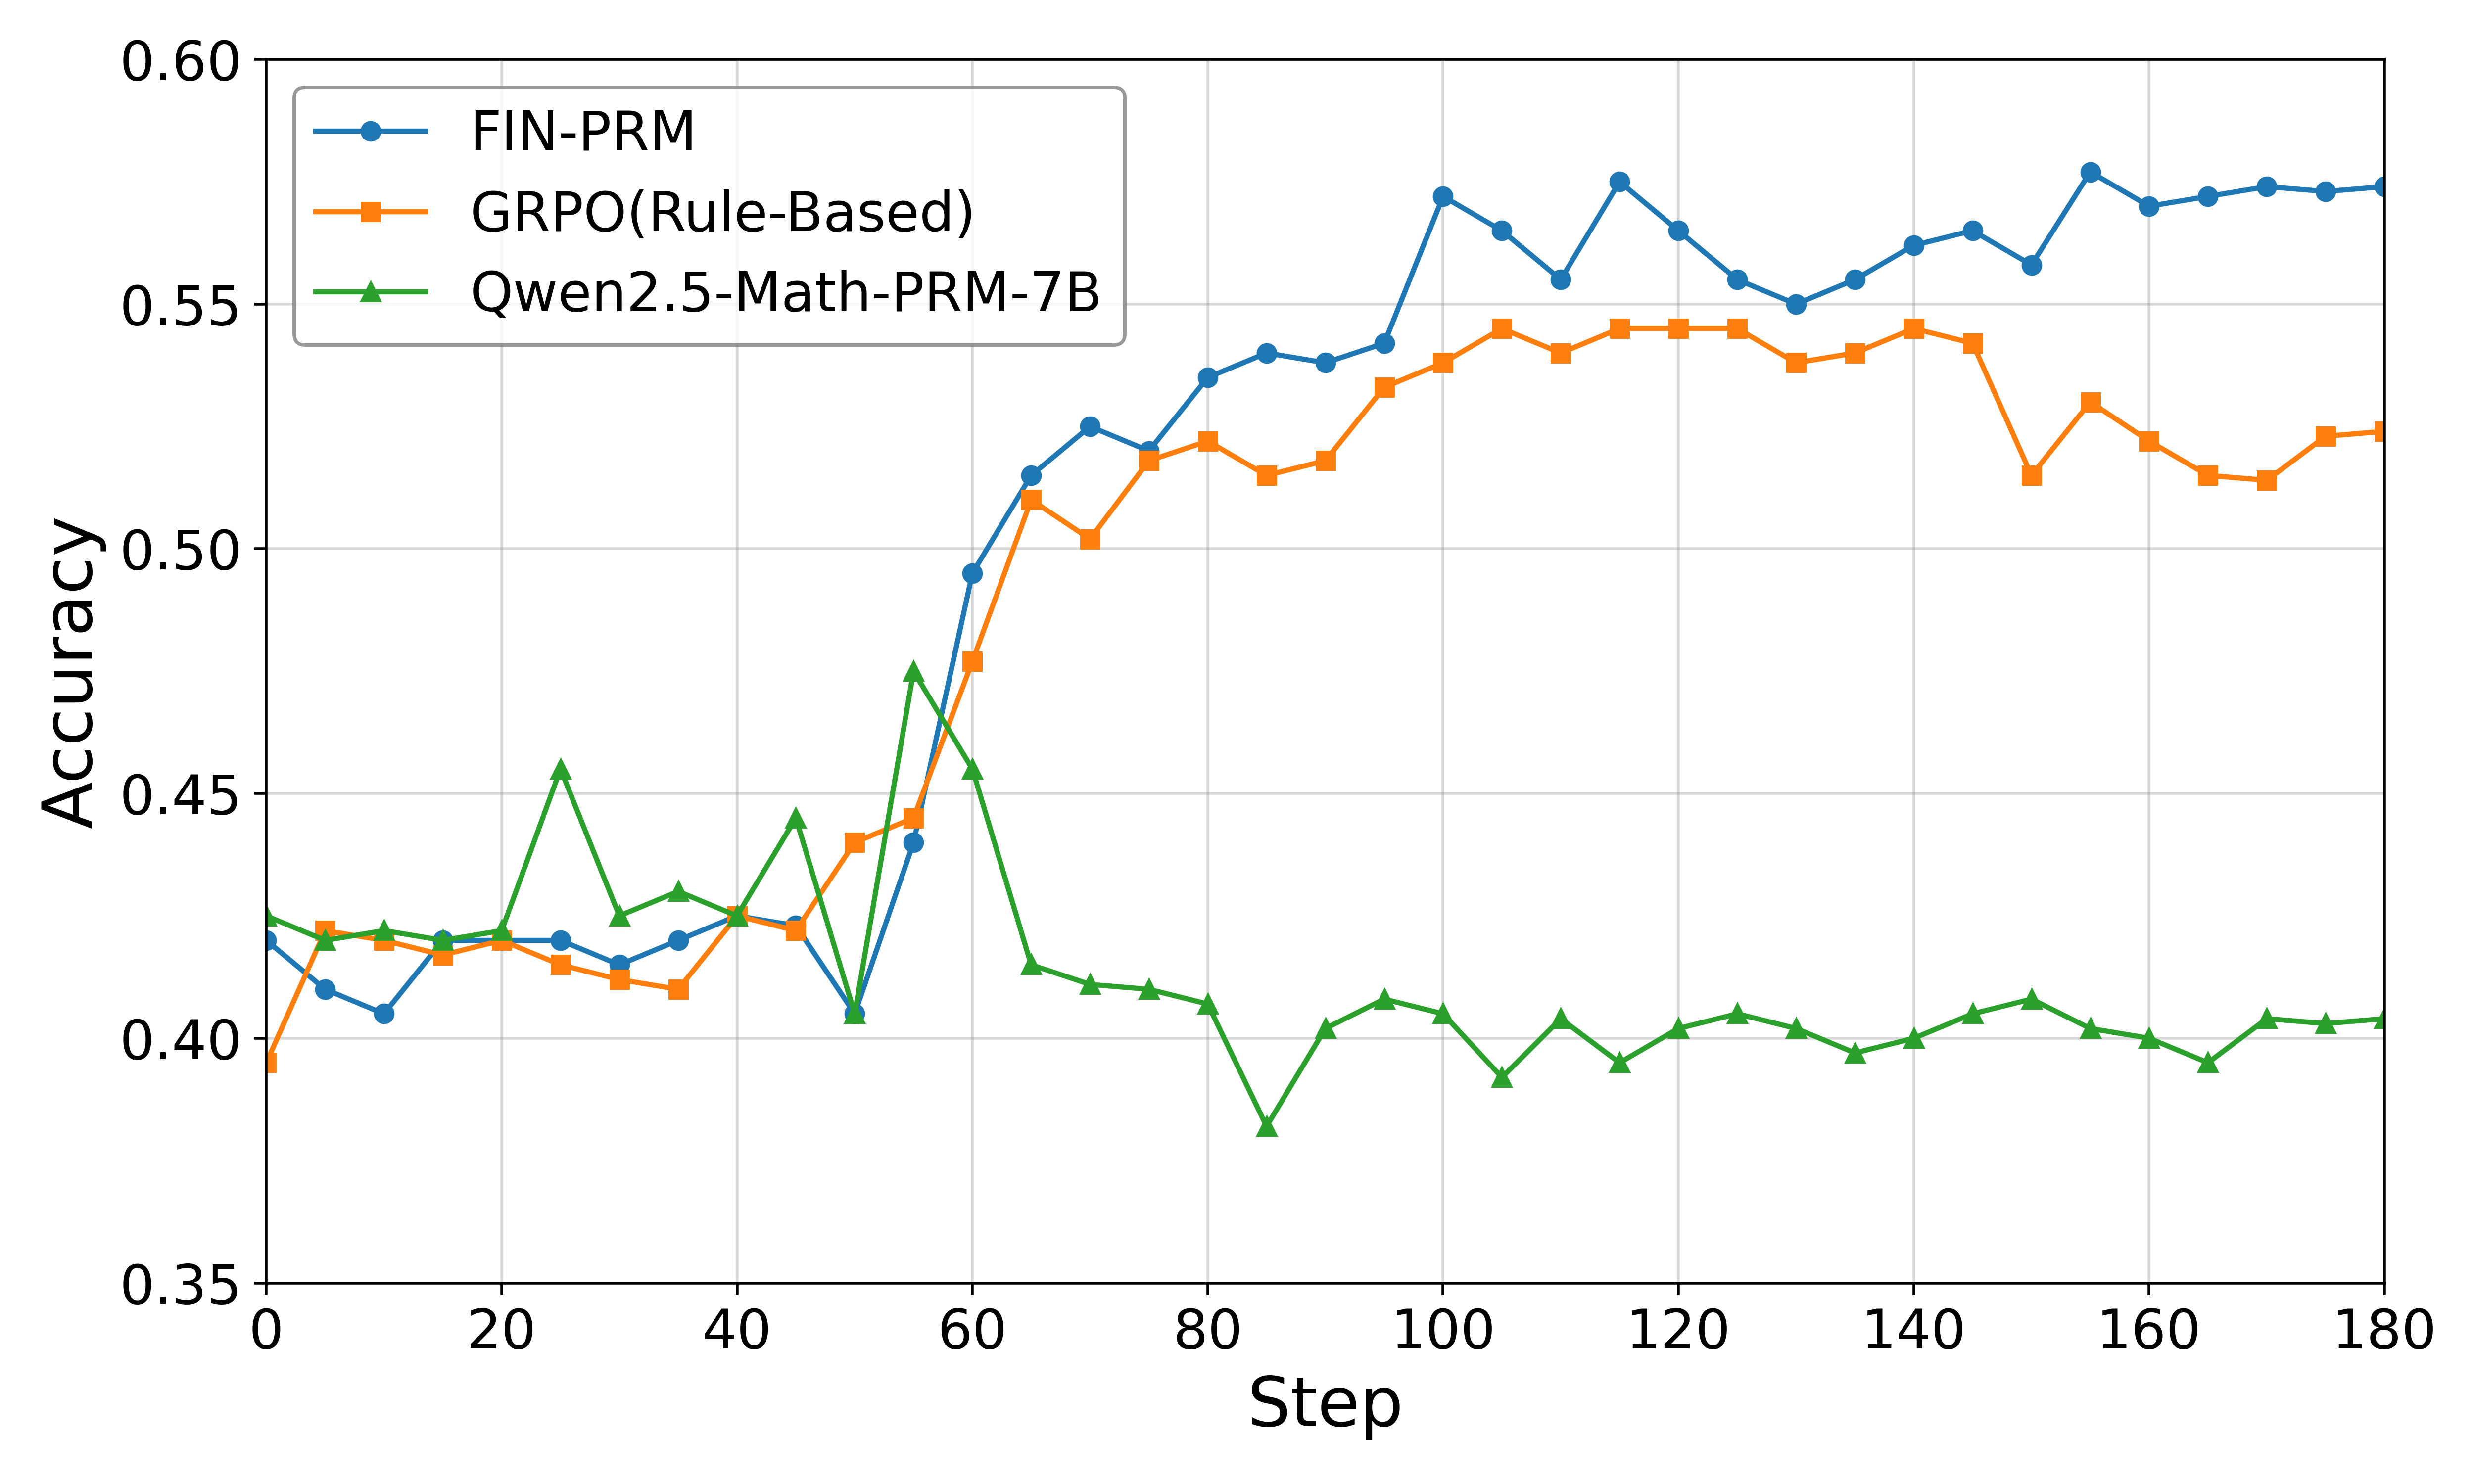
The image is a line chart comparing the accuracy of three different models (FIN-PRM, GRPO(Rule-Based), and Qwen2.5-Math-PRM-7B) over a range of steps. The chart displays accuracy on the y-axis and step on the x-axis.
### Components/Axes
* **X-axis:** "Step", ranging from 0 to 180 in increments of 20.
* **Y-axis:** "Accuracy", ranging from 0.35 to 0.60 in increments of 0.05.
* **Legend (top-left):**
* Blue line with circle markers: "FIN-PRM"
* Orange line with square markers: "GRPO(Rule-Based)"
* Green line with triangle markers: "Qwen2.5-Math-PRM-7B"
### Detailed Analysis
* **FIN-PRM (Blue):** The accuracy of FIN-PRM generally increases from approximately 0.42 at step 0 to approximately 0.57 at step 180. The line slopes upward from step 0 to step 60, reaching approximately 0.52. It continues to increase with some fluctuations, peaking around step 110 at approximately 0.58, and then stabilizes around 0.57.
* Step 0: ~0.42
* Step 60: ~0.52
* Step 110: ~0.58
* Step 180: ~0.57
* **GRPO(Rule-Based) (Orange):** The accuracy of GRPO(Rule-Based) increases from approximately 0.40 at step 0 to approximately 0.54 around step 100. After step 100, the accuracy fluctuates between 0.52 and 0.55, ending at approximately 0.52 at step 180.
* Step 0: ~0.40
* Step 60: ~0.50
* Step 100: ~0.54
* Step 180: ~0.52
* **Qwen2.5-Math-PRM-7B (Green):** The accuracy of Qwen2.5-Math-PRM-7B starts at approximately 0.42 at step 0, increases sharply to approximately 0.47 by step 50, then drops to approximately 0.41 by step 70. After step 70, the accuracy fluctuates between approximately 0.38 and 0.41, ending at approximately 0.40 at step 180.
* Step 0: ~0.42
* Step 50: ~0.47
* Step 70: ~0.41
* Step 180: ~0.40
### Key Observations
* FIN-PRM consistently outperforms the other two models in terms of accuracy after approximately step 70.
* GRPO(Rule-Based) shows a similar initial increase in accuracy to FIN-PRM, but plateaus and fluctuates after step 100.
* Qwen2.5-Math-PRM-7B shows an initial spike in accuracy, but then drops and remains relatively stable at a lower accuracy level.
### Interpretation
The chart demonstrates the performance of three different models over a series of steps, likely during a training or evaluation process. FIN-PRM appears to be the most effective model, achieving the highest and most stable accuracy. GRPO(Rule-Based) shows promise initially but plateaus. Qwen2.5-Math-PRM-7B has an initial spike but then settles at a lower accuracy, suggesting it may not be as effective for this particular task or requires further optimization. The "step" likely represents iterations or batches of data processed during training.