\n
## Line Chart: Accuracy vs. Step for Different Models
### Overview
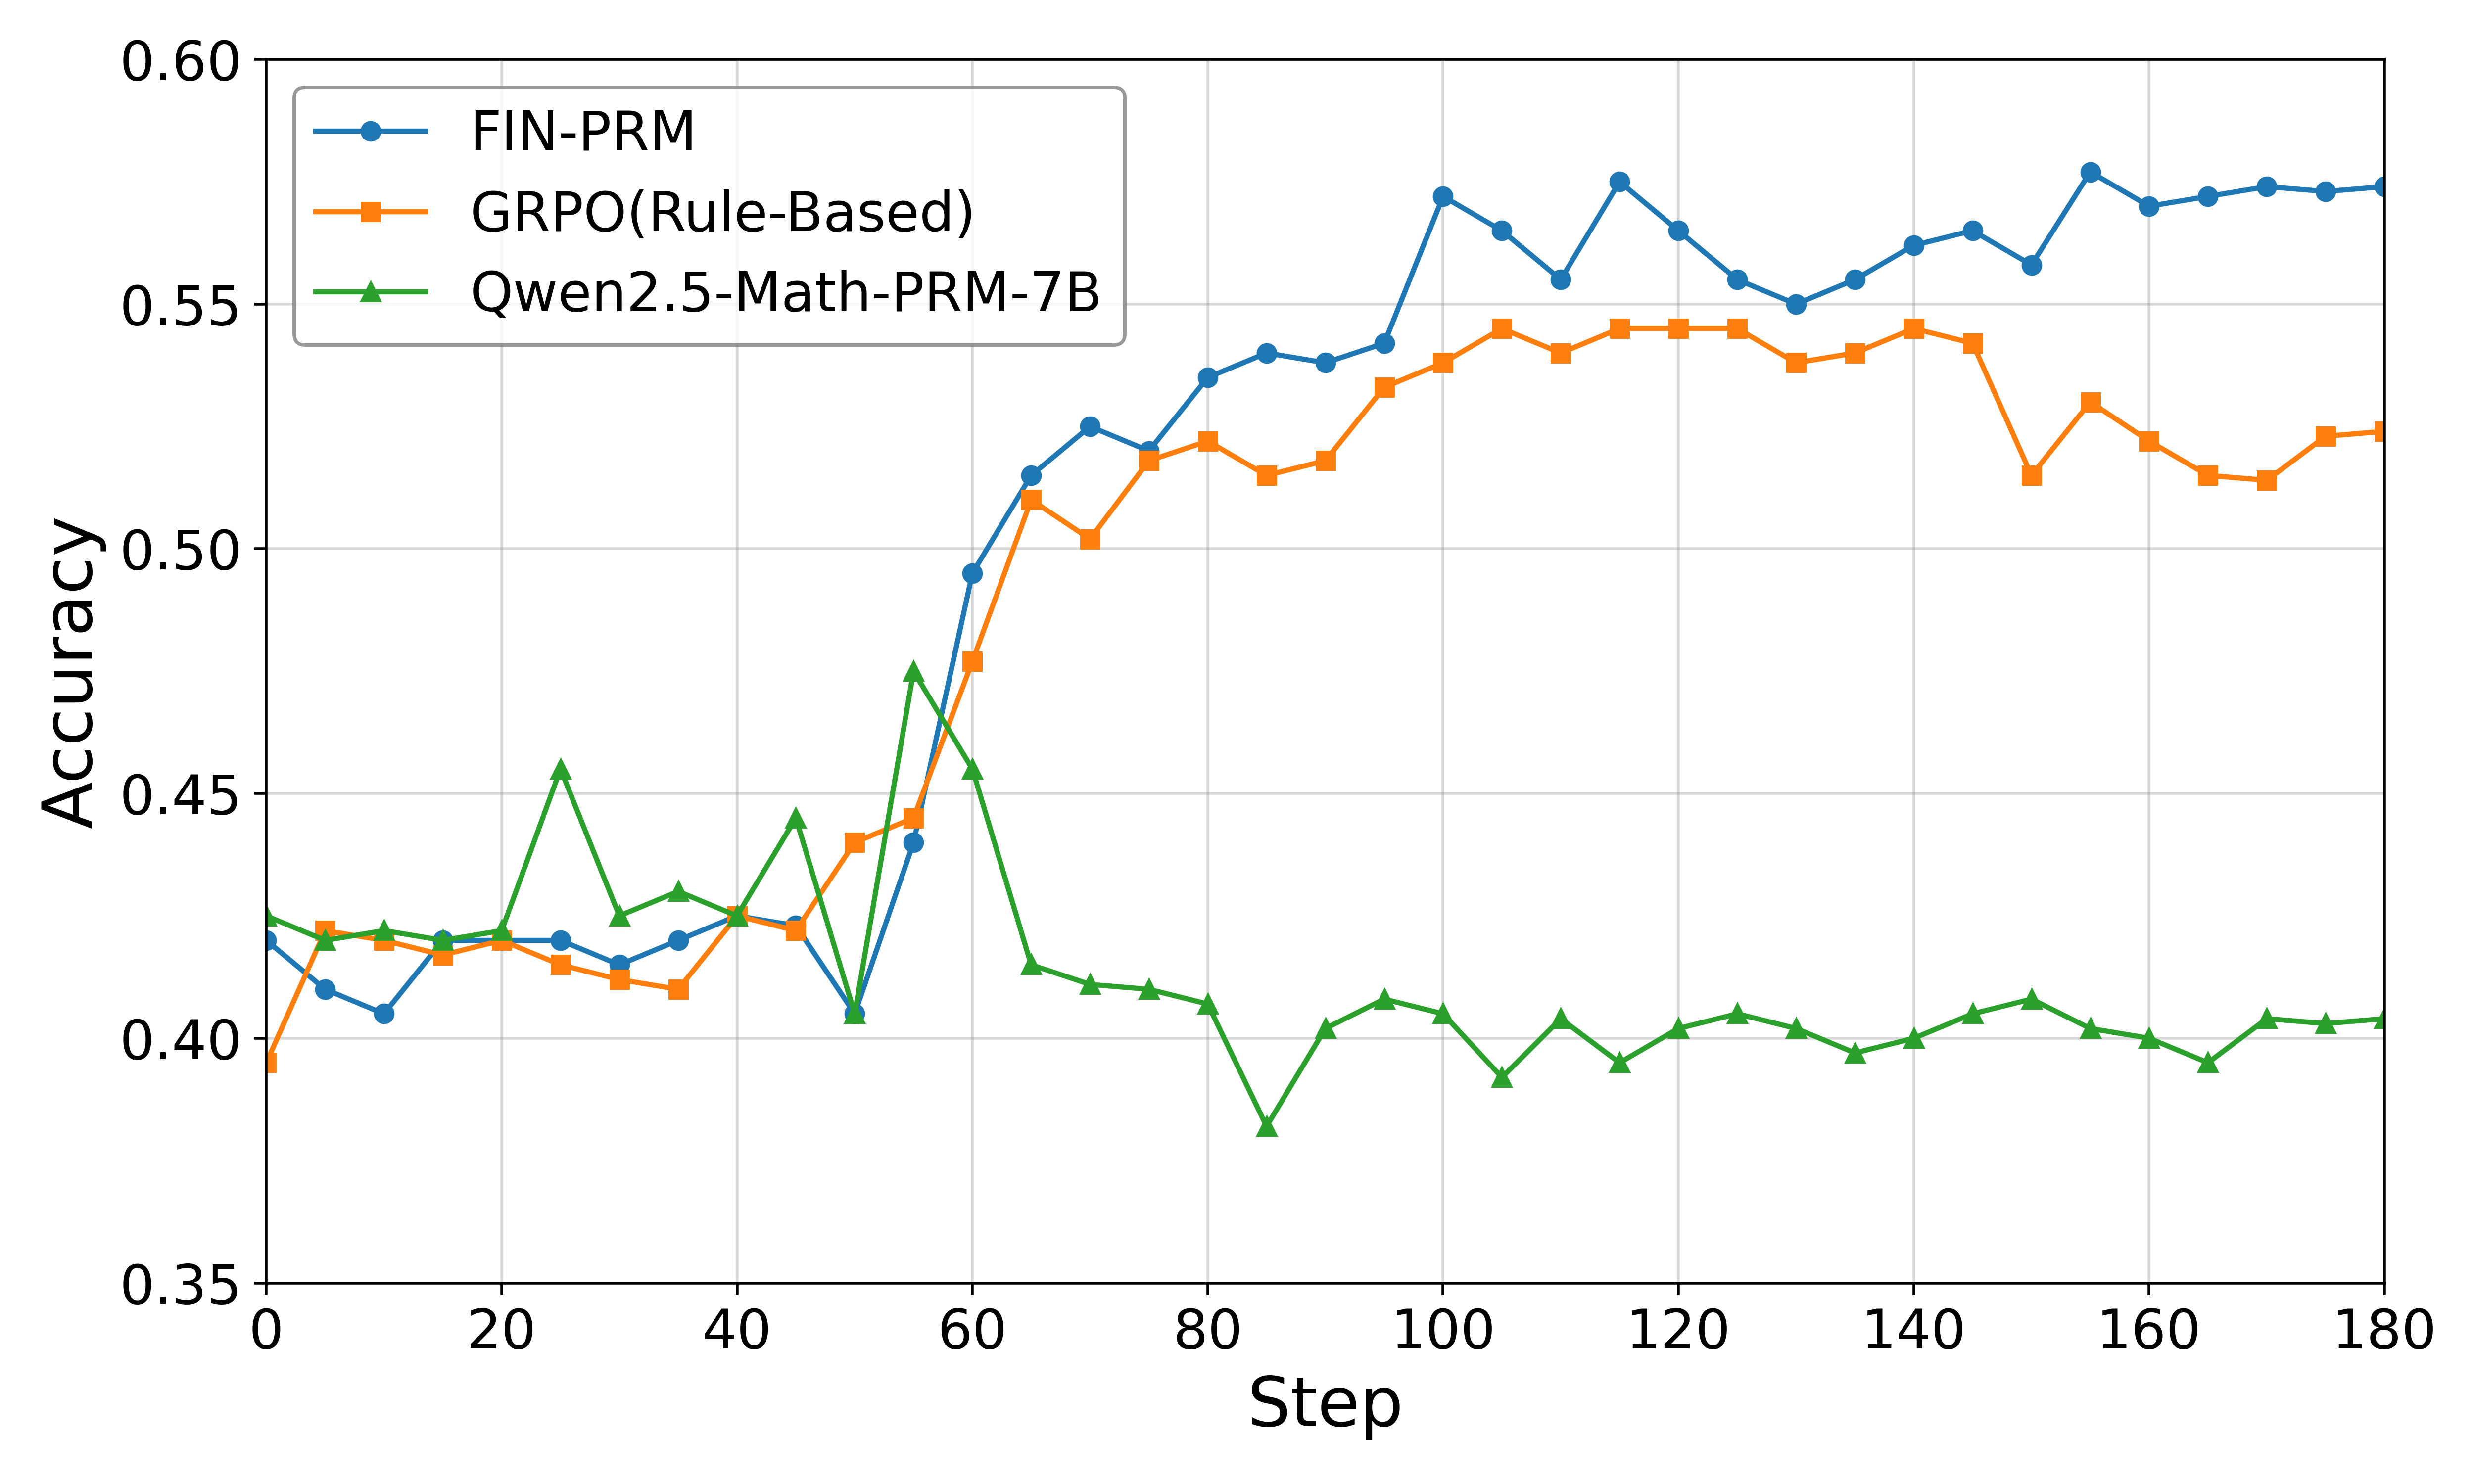
This image presents a line chart comparing the accuracy of three different models – FIN-PRM, GRPO(Rule-Based), and Qwen2.5-Math-PRM-7B – over 180 steps. The chart visualizes how the accuracy of each model changes as the training or evaluation progresses through these steps.
### Components/Axes
* **X-axis:** "Step" ranging from 0 to 180.
* **Y-axis:** "Accuracy" ranging from 0.35 to 0.60.
* **Legend:** Located at the top-left corner of the chart.
* FIN-PRM (Blue line with circle markers)
* GRPO(Rule-Based) (Orange line with square markers)
* Qwen2.5-Math-PRM-7B (Green line with triangle markers)
* **Gridlines:** Present to aid in reading values.
### Detailed Analysis
Here's a breakdown of each model's performance based on the chart:
**1. FIN-PRM (Blue Line):**
* **Trend:** The line generally slopes upward, with fluctuations. It starts around 0.42 at Step 0, rises to a peak of approximately 0.58 at Step 100, then plateaus and fluctuates between 0.55 and 0.57 until Step 180.
* **Data Points (approximate):**
* Step 0: 0.42
* Step 20: 0.44
* Step 40: 0.48
* Step 60: 0.53
* Step 80: 0.55
* Step 100: 0.58
* Step 120: 0.57
* Step 140: 0.56
* Step 160: 0.56
* Step 180: 0.56
**2. GRPO(Rule-Based) (Orange Line):**
* **Trend:** This line shows a more gradual increase, with a steeper rise between Steps 40 and 80. It starts around 0.41 at Step 0, increases to approximately 0.53 at Step 80, and then fluctuates between 0.52 and 0.54 until Step 180.
* **Data Points (approximate):**
* Step 0: 0.41
* Step 20: 0.43
* Step 40: 0.46
* Step 60: 0.50
* Step 80: 0.53
* Step 100: 0.53
* Step 120: 0.53
* Step 140: 0.53
* Step 160: 0.53
* Step 180: 0.53
**3. Qwen2.5-Math-PRM-7B (Green Line):**
* **Trend:** This line exhibits a more erratic pattern, with an initial decrease followed by a slight recovery. It starts around 0.41 at Step 0, dips to approximately 0.39 at Step 60, and then gradually increases to around 0.41 by Step 180.
* **Data Points (approximate):**
* Step 0: 0.41
* Step 20: 0.42
* Step 40: 0.43
* Step 60: 0.39
* Step 80: 0.40
* Step 100: 0.40
* Step 120: 0.40
* Step 140: 0.40
* Step 160: 0.40
* Step 180: 0.41
### Key Observations
* FIN-PRM consistently achieves the highest accuracy throughout the 180 steps, peaking around Step 100.
* GRPO(Rule-Based) shows a steady improvement, but its final accuracy is lower than FIN-PRM.
* Qwen2.5-Math-PRM-7B demonstrates the lowest and most unstable accuracy, with a slight decline in the initial stages.
* The accuracy of FIN-PRM and GRPO(Rule-Based) appears to converge towards the end of the training/evaluation process.
### Interpretation
The chart suggests that FIN-PRM is the most effective model among the three, consistently outperforming the others in terms of accuracy. GRPO(Rule-Based) shows a reasonable level of performance, while Qwen2.5-Math-PRM-7B struggles to achieve comparable accuracy. The convergence of FIN-PRM and GRPO(Rule-Based) towards the end of the process could indicate that the benefits of the more complex FIN-PRM model diminish as training progresses, or that the GRPO(Rule-Based) model is approaching its performance limit. The erratic behavior of Qwen2.5-Math-PRM-7B might be due to issues with its architecture, training data, or hyperparameters. Further investigation would be needed to understand the reasons behind its poor performance. The data suggests that the step count is a relevant factor in model performance, with accuracy generally increasing with more steps, although the rate of increase varies between models.