## Line Graphs: Lichess Puzzle Accuracy vs. Training Steps for Qwen2.5-7B and Llama3.1-8B
### Overview
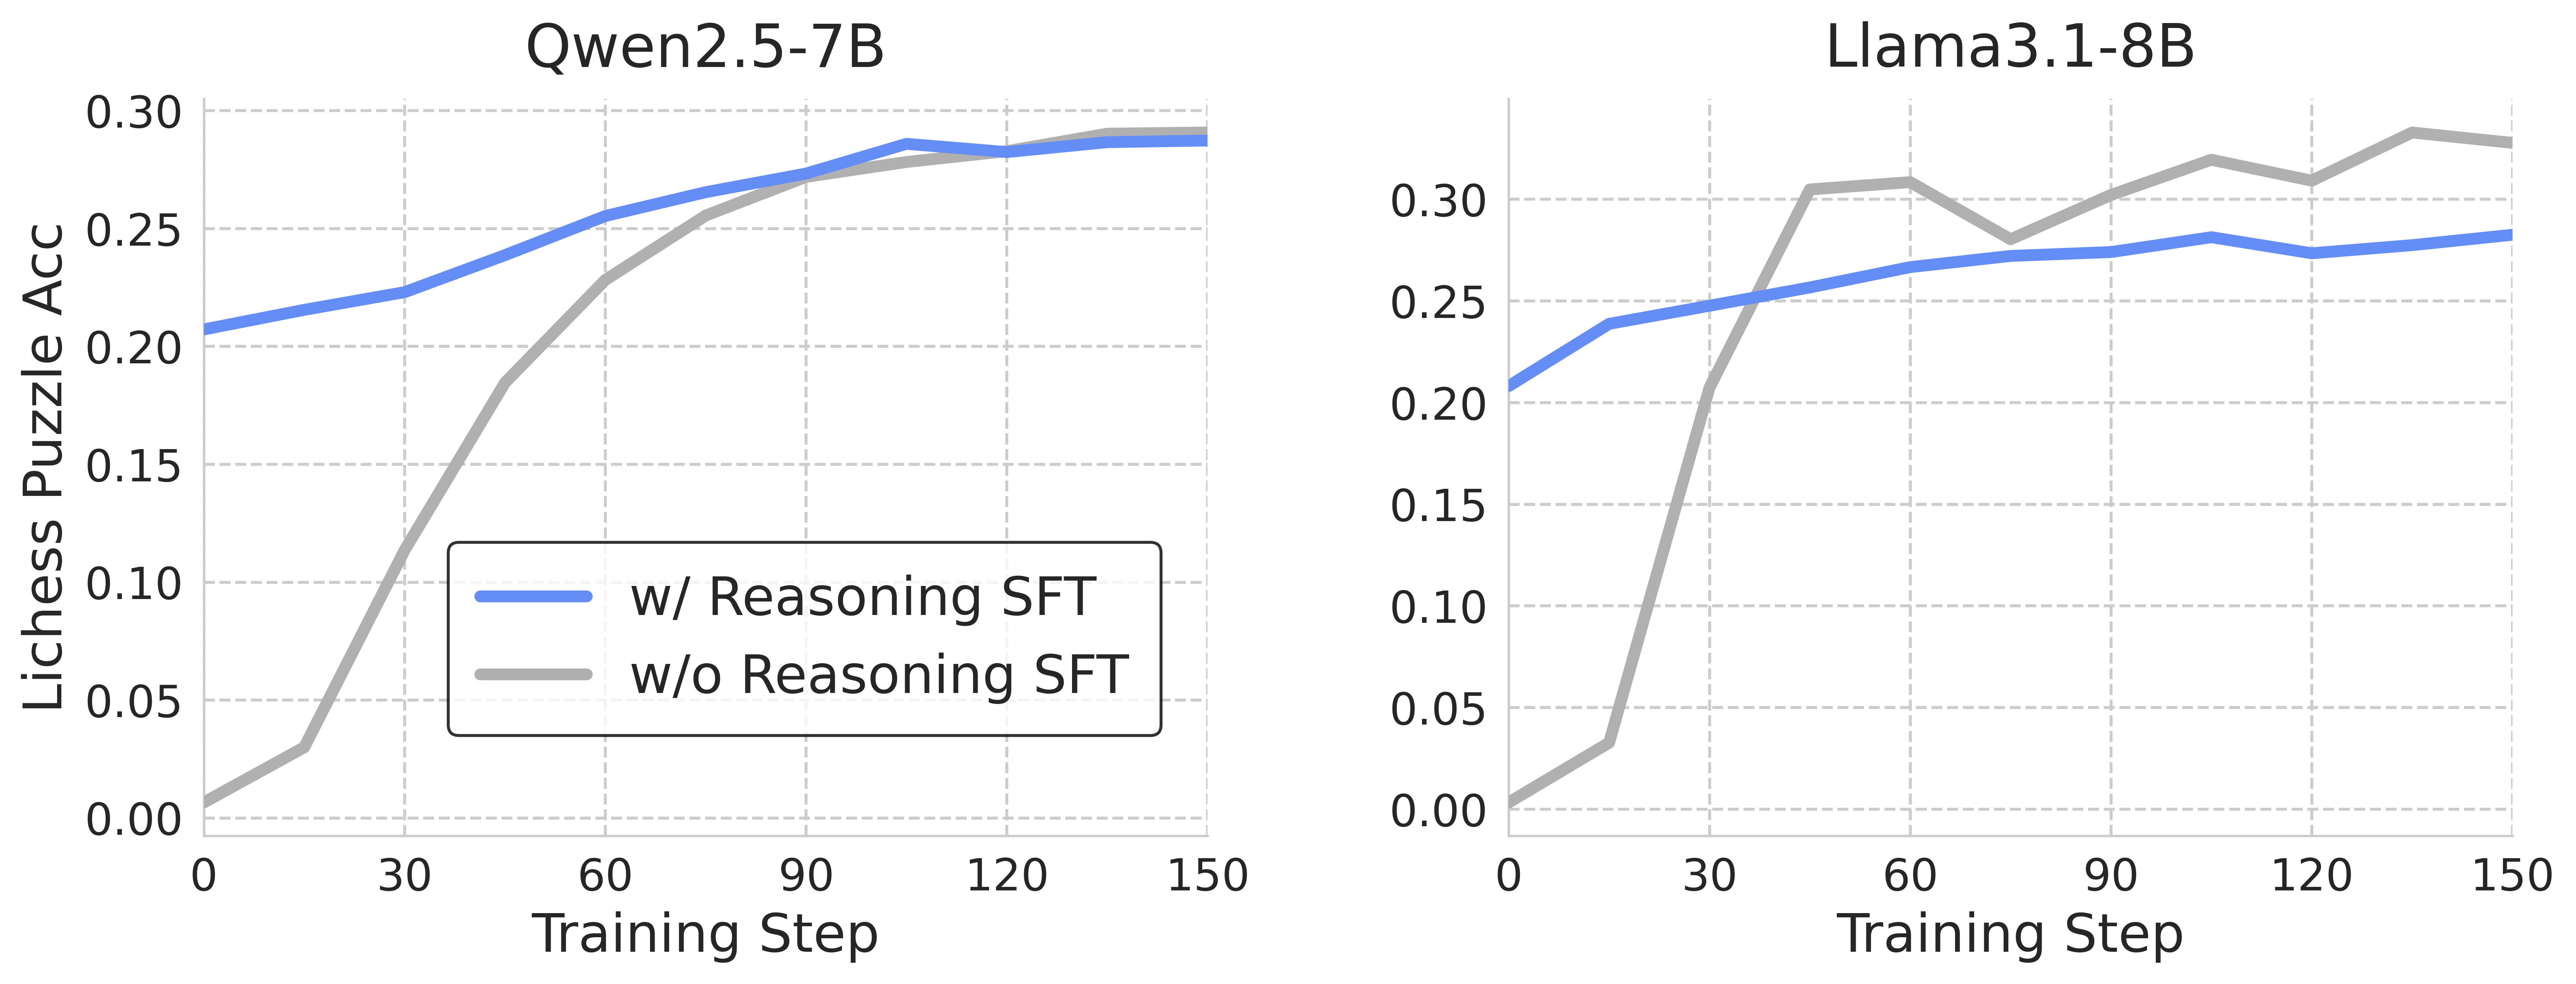
The image contains two side-by-side line graphs comparing the performance of two AI models (Qwen2.5-7B and Llama3.1-8B) during training. Each graph tracks "Lichess Puzzle Accuracy" (y-axis) against "Training Step" (x-axis, 0–150). Two data series are shown per model:
- **Blue line**: Performance with Reasoning SFT (Supervised Fine-Tuning)
- **Gray line**: Performance without Reasoning SFT
### Components/Axes
- **X-axis (Training Step)**:
- Range: 0 to 150 (increments of 30)
- Labels: "Training Step"
- **Y-axis (Lichess Puzzle Acc)**:
- Range: 0.00 to 0.30 (increments of 0.05)
- Labels: "Lichess Puzzle Acc"
- **Legends**:
- Positioned in the bottom-left corner of each graph.
- Blue: "w/ Reasoning SFT"
- Gray: "w/o Reasoning SFT"
### Detailed Analysis
#### Qwen2.5-7B (Left Graph)
- **Blue line (w/ Reasoning SFT)**:
- Starts at ~0.20 (step 0) and increases steadily to ~0.29 (step 150).
- Slope: Gradual upward trend with minimal fluctuations.
- **Gray line (w/o Reasoning SFT)**:
- Starts at 0.00 (step 0) and rises sharply to ~0.25 (step 60), then plateaus.
- Slope: Steep initial increase, followed by a plateau.
#### Llama3.1-8B (Right Graph)
- **Blue line (w/ Reasoning SFT)**:
- Starts at ~0.20 (step 0) and increases to ~0.28 (step 150).
- Slope: Steady upward trend with minor fluctuations.
- **Gray line (w/o Reasoning SFT)**:
- Starts at 0.00 (step 0) and spikes to ~0.30 (step 30), then fluctuates between ~0.28–0.30.
- Slope: Rapid initial rise, followed by volatility.
### Key Observations
1. **Performance Trends**:
- Both models show improved performance with Reasoning SFT (blue lines outperform gray lines initially).
- Qwen2.5-7B’s gray line converges with the blue line by step 150 (~0.29 vs. ~0.29).
- Llama3.1-8B’s gray line surpasses the blue line (~0.30 vs. ~0.28) but exhibits instability.
2. **Model Differences**:
- Llama3.1-8B achieves higher peak accuracy (0.30) but with greater variability.
- Qwen2.5-7B demonstrates more stable convergence between SFT and non-SFT approaches.
3. **Anomalies**:
- Llama3.1-8B’s gray line shows a sharp dip to ~0.28 at step 60, suggesting potential overfitting or instability.
### Interpretation
The data suggests that **Reasoning SFT improves performance** for both models, but the impact varies:
- **Qwen2.5-7B**: SFT provides a consistent boost, with non-SFT performance catching up over time.
- **Llama3.1-8B**: SFT yields higher initial gains, but non-SFT performance eventually exceeds SFT, possibly due to overfitting or architectural differences.
The graphs highlight the trade-off between stability (Qwen) and peak performance (Llama), with Llama’s volatility raising questions about the reliability of non-SFT training. Further investigation into training dynamics and model architecture could clarify these trends.