## Bar Chart: Δ w.r.t. average human rater (%)
### Overview
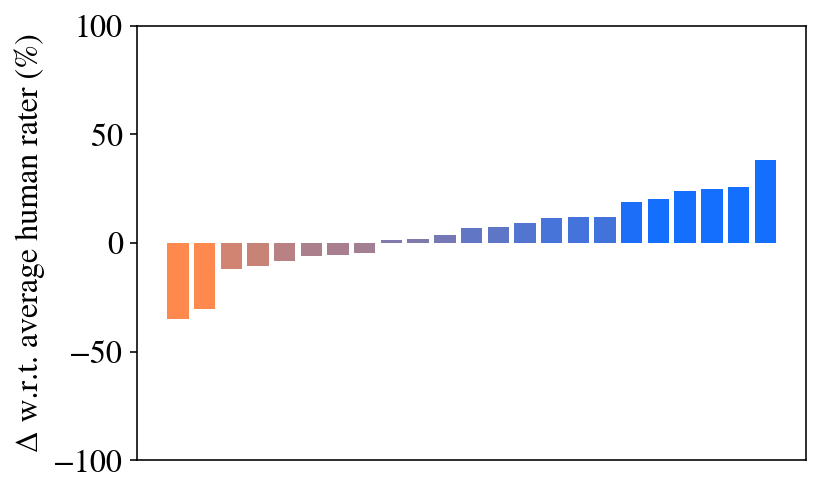
The chart displays a bar graph comparing the change in average human rater percentage (Δ w.r.t. average human rater) across three categories: "Negative", "Neutral", and "Positive". The y-axis represents percentage values ranging from -100% to 100%, while the x-axis categorizes the data into the three groups. The bars are color-coded: red for "Negative", brown for "Neutral", and blue for "Positive".
### Components/Axes
- **X-axis (Categories)**:
- "Negative" (leftmost)
- "Neutral" (middle)
- "Positive" (rightmost)
- **Y-axis (Values)**:
- Labeled "Δ w.r.t. average human rater (%)"
- Scale: -100% to 100% in increments of 50%
- **Legend**:
- Located on the right side of the chart.
- Red = "Negative"
- Brown = "Neutral"
- Blue = "Positive"
### Detailed Analysis
- **Negative Category**:
- Three bars with approximate values: -70%, -60%, and -50%.
- All bars are below the zero line, indicating a decline in average human rater percentage.
- **Neutral Category**:
- Three bars with approximate values: -10%, 0%, and 10%.
- Bars are near the zero line, showing minimal change.
- **Positive Category**:
- Three bars with approximate values: 10%, 20%, and 40%.
- The tallest bar (40%) is in this category, indicating the highest increase.
### Key Observations
1. The "Positive" category shows the most significant improvement, with the largest bar at 40%.
2. The "Negative" category exhibits the most substantial declines, with values ranging from -70% to -50%.
3. The "Neutral" category remains relatively stable, with values close to 0%.
### Interpretation
The data suggests a clear trend where the "Positive" category demonstrates the greatest improvement in average human rater percentage, while the "Negative" category shows the most significant declines. The "Neutral" category remains relatively unchanged, indicating stability. This could imply that the intervention or variable being measured had a more favorable impact on the "Positive" group, whereas the "Negative" group experienced a notable deterioration. The "Neutral" category’s stability might reflect a lack of significant change or a balanced effect. The chart highlights the importance of addressing the "Negative" category to mitigate its adverse impact, while leveraging the "Positive" trends for further optimization.