## Diagram: Directed Graph with Labeled Nodes
### Overview
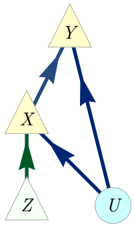
The image displays a directed graph consisting of four nodes labeled 'X', 'Y', 'Z', and 'U'. The nodes are represented by geometric shapes: triangles for 'X', 'Y', and 'Z', and a circle for 'U'. Arrows indicate the direction of the relationships between these nodes.
### Components/Axes
* **Nodes:**
* 'X': A yellow triangle.
* 'Y': A yellow triangle.
* 'Z': A light green triangle.
* 'U': A light blue circle.
* **Edges (Directed):**
* An arrow from 'Z' to 'X' (dark green).
* An arrow from 'X' to 'Y' (dark blue).
* An arrow from 'X' to 'U' (dark blue).
* An arrow from 'Y' to 'U' (dark blue).
### Detailed Analysis
The diagram illustrates a network of dependencies or influences.
* 'Z' has a direct influence on 'X', indicated by the green arrow pointing from 'Z' to 'X'.
* 'X' influences both 'Y' and 'U', shown by dark blue arrows originating from 'X' and pointing to 'Y' and 'U' respectively.
* 'Y' also influences 'U', represented by a dark blue arrow from 'Y' to 'U'.
### Key Observations
* Node 'U' is a sink node, receiving influence from both 'X' and 'Y'.
* Node 'X' acts as an intermediary, receiving influence from 'Z' and propagating it to 'Y' and 'U'.
* Node 'Y' receives influence from 'X' and also influences 'U'.
* Node 'Z' is a source node in this depicted subgraph, with an outgoing edge but no incoming edges shown.
### Interpretation
This diagram represents a directed acyclic graph (DAG) or a portion of a larger directed graph. The different colors of the arrows (green for Z->X, dark blue for all others) might signify different types of relationships, strengths, or categories of influence. The structure suggests a flow of information or causality. For instance, 'Z' could be an initial input or cause, which affects 'X'. 'X' then acts as a mediator, impacting both 'Y' and 'U'. 'Y' itself is also influenced by 'X' and, in turn, contributes to 'U'. The node 'U' appears to be an endpoint or a final outcome influenced by multiple preceding nodes. Without further context, the specific meaning of these relationships and the significance of the node labels ('X', 'Y', 'Z', 'U') remain abstract. However, the visual representation clearly delineates a hierarchical or sequential dependency structure.